Article Text

Abstract
Background An earlier investigation found increased bladder cancer incidence among workers at a rubber chemical manufacturing plant that used o-toluidine, aniline and nitrobenzene. The cohort was expanded to include additional workers (n=1875) and updated through 2007 to assess bladder cancer with improved exposure characterisation.
Methods Work histories were updated and exposure categories and ranks were developed for o-toluidine, aniline and nitrobenzene combined. Incident cancers were identified by linkage to six state cancer registries. Residency in time-dependent cancer registry catchment areas was determined. SIR and standardised rate ratios for bladder cancer were calculated by exposure category and cumulative rank quartiles for different lag periods. Cox regression was used to model bladder cancer incidence with estimated cumulative rank, adjusting for confounders. Indirect methods were used to control for smoking.
Results Excess bladder cancer was observed compared to the New York State population (SIR=2.87, 95% CI 2.02 to 3.96), with higher elevations among workers definitely exposed (moderate/high) (SIR=3.90, 95% CI 2.57 to 5.68), and in the highest cumulative rank quartile (SIR=6.13, 95% CI 2.80 to 11.6, 10-year lag). Bladder cancer rates increased significantly with estimated cumulative rank (10-year lag). Smoking only accounted for an estimated 8% elevation in bladder cancer incidence.
Conclusions Bladder cancer incidence remains elevated in this cohort and significantly associated with estimated cumulative exposure. Results are consistent with earlier findings in this and other cohorts. Despite other concurrent chemical exposures, we consider o-toluidine most likely responsible for the bladder cancer incidence elevation and recommend a re-examination of occupational exposure limits.
Statistics from Altmetric.com
What this paper adds
-
An earlier investigation at this rubber chemical manufacturing plant found increased bladder cancer incidence among workers exposed to o-toluidine, aniline and nitrobenzene.
-
We expanded the cohort and added an additional 18 years of follow-up. We linked the cohort to six state cancer registries, and used updated work histories to develop exposure categories and ranks.
-
We report excess bladder cancer in the cohort compared with the New York State population. Bladder cancer incidence was elevated among all workers, except those considered not exposed. Incidence increased with increasing exposure.
-
We consider o-toluidine the agent most probably responsible for the bladder cancer elevation, and recommend a re-examination of occupational exposure limits.
Introduction
ortho-Toluidine (o-Toluidine) is an aromatic amine used primarily in the manufacture of dyestuffs, and in the production of synthetic rubber, chemicals and pesticides, and as a curing agent for epoxy resin systems. o-Toluidine was classified by the International Agency for Research on Cancer (IARC) as ‘carcinogenic to humans’ (Group 1),1 based largely on a retrospective cohort study conducted by the National Institute for Occupational Safety and Health (NIOSH) among 1749 workers in a New York State rubber chemical manufacturing plant.2 That study, and our subsequent reanalysis using updated exposure categories,3 showed excess bladder cancer incidence in the cohort from 1973 through 1988 compared to the New York State (excluding New York City) population (13 cases, SIR=3.64; 95% CI=1.94 to 6.23). Workers considered definitively exposed to o-toluidine, aniline and a proprietary chemical later identified as nitrobenzene, had a nearly sixfold excess of bladder cancer. Bladder cancer was strongly associated with increased duration of employment in the rubber chemicals department which used o-toluidine, aniline and nitrobenzene to synthesise rubber accelerators and antioxidants (SIR=11.09, 95% CI 5.07 to 21.05 among workers with 10 or more years of employment).
Markowitz and Levin4 ,5 identified 19 additional bladder cases among workers from this plant; all but one diagnosed between 1991 and 2003. However, the authors could not evaluate risk or update the cohort study because they lacked access to the roster of workers. Furthermore, they declared that the original exposure assignments, defined only by work departments, could be improved by considering specific jobs in those departments.
This report updates the historical cohort study conducted by NIOSH and includes 18 additional years of follow-up. The cohort was expanded to include workers hired after 1988, as well as those inadvertently excluded from the previous study. To minimise loss of case ascertainment due to migration to other states, cases were identified by linkage to six state cancer registries. Additionally, exposure assessment to o-toluidine, aniline and nitrobenzene was further refined using exposure categories defined by department-job combinations, rather than only departments, and by approximating relative exposure ranks for each department-job-year combination.
Methods
Study population
Details about cohort enumeration and mortality through 2007 are presented elsewhere (T Carreón, unpublished data, 2013). Briefly, the cohort includes workers ever employed at the plant 1 day or more between 1946 and 2006 (n=1875). To ascertain vital status and causes of death, worker data were linked to Social Security Administration records and the National Death Index (NDI). Causes of death were obtained from NDI Plus, and a special request was submitted to the Florida Department of Health for causes of deaths in that state. For deaths prior to 1979, death certificates were obtained from state vital statistics offices and coded to the International Classification of Diseases (ICD) revision in effect at the time of death by a certified nosologist. Eligible workers for the bladder cancer incidence analysis included all workers in the cohort, except workers who died (n=33) or were otherwise lost to follow-up (n=30) prior to the earliest inception date (1976) of the participating cancer registries.
This study has been approved by the NIOSH Institutional Review Board and by each participating state cancer registry.
Case identification
We matched eligible workers (n=1812) to the New York State Cancer Registry, considered complete, beginning 1 January 1976. We also matched all workers to cancer registries in Pennsylvania, California, Ohio, Texas and Florida for which complete ascertainment began in 1985, 1988, 1992, 1995 and 1997, respectively. Ninety-five percent of workers had last known residence in one of these states at the time of linkage application submissions. Among eligible workers, 343 of 411 deaths (83%) through 2007 occurred in one of these six states (New York, 269; Pennsylvania, 12; California, 14; Ohio, 8, Texas, 4; Florida, 36); the remaining deaths occurred outside the country (n=3), in 24 other states (n=54), or at unknown locations (n=11).
From each cancer registry, we requested: date of diagnosis, state of residence at diagnosis, and ICD for Oncology Third Edition (ICD-O-3) codes for primary site, laterality, morphology (histology and behavior) and grade. Matching methodology varied slightly across the cancer registries; each used a probabilistic algorithm to identify matches based on social security number (SSN), date of birth, last, first and middle names, sex, address and race/ethnicity, and assigned scores based on the strength of matches. Registry matches with ICD-O-3 site codes 8010, 8070, 8120, 8130 and 8140 were used to identify invasive (behavior code 3) and in situ (behavior code 2) bladder cancer cases. Diagnosis dates were assigned as 1 January if only the diagnosis year was known, and on the 1st of the diagnosis month if only the diagnosis month and year were known.
Person-time calculation
To coordinate data from multiple cancer registries with different inception dates, available addresses for workers were used to determine dates when they first entered and first left the time-dependent cancer registry catchment area. At first, the catchment area encompassed New York State, beginning in 1976. Pennsylvania joined the catchment area in 1985; the catchment area was enlarged over time to include additional states. For 1997–2007, the catchment area included all six states.
Multiple sources of address information were considered. First, workers were assumed to have resided in New York while employed at the plant. Company-provided work history records indicated work at offsite locations for some workers (n=78); these workers were assumed to have resided in the offsite state while employed there. In 2004, the company provided the last known addresses for a subset of workers (n=852). For workers alive in 2004, these addresses were assumed to be valid; for workers deceased prior to 2004, the address was associated with the death year. LexisNexis Public Records (Los Angeles, California, USA) provided address information for 1602 workers by matching on first and last name, last address, date of birth and SSN. The Internal Revenue Service, Post Office and credit services provided additional addresses for 1683 workers.
Since only state of residence changes were relevant, these sources of information were combined to create a residence history for each worker. We divided time periods with no known address information at the midpoint and assigned the first half to the earlier state and the second half to the later state. For a given follow-up year, a worker was considered to be in the registry catchment if known to be living in at least one state associated with the catchment area in that year.
Exposure assessment
We have described in detail6 operations at the plant, our development of exposure categories based on department-job combinations and relative exposure ranks based on department-job-year combinations. Briefly, detailed work history records including begin/end dates, department and job title were available for all workers from 1946 to 2006. Work history records were assigned to one of four exposure categories (PNE, probably not exposed; PEI, probably exposed low and irregularly/occasionally; PER, probably exposed low and regularly; DER, definitely exposed moderate/high and regularly) representing exposures to o-toluidine, aniline and nitrobenzene. Each department and job-title combination was assigned a relative rank (0–10) for these exposures within eras of employment (<1954, 1954–1960, 1961–1969, 1970–1979, 1980–1994, 1995–2005, and 2006+). The relative ranks were used to estimate the cumulative exposure rank defined as the product of the number of days in each department/job-title and the assigned rank, summed over all jobs worked. Since the ranks were unitless, the cumulative rank was expressed as unit-days.
Life-table methods
SIRs were used to compare the bladder cancer rate among workers at the plant to a state-specific referent population using the NIOSH life-table analysis programme (LTAS.NET).7 For each worker, the risk begin date was the later of the date of first employment and the date the worker first entered the catchment area, and the risk end date was the earliest of the date of diagnosis, the date last observed, the date of death, the date the worker first left the catchment area or the study end date (for workers alive on 31 Dec 2007 and not known to have left the catchment area). Person-time-at-risk was stratified by age and calendar year (both in 5-year categories) and multiplied by gender-specific and race-specific bladder cancer incidence rates to obtain expected numbers of cases. Bladder cancer (invasive and in situ) incidence rates for the population of New York State excluding New York City (1976–2007) were obtained from the New York State Cancer Registry (AR Kahn, written communication, February 2011). The SIR was defined as the ratio of observed to expected numbers of cases and 95% CIs were estimated under the assumption of a Poisson distribution. We compared directly standardised rates of bladder cancer incidence among workers in higher exposure categories or with higher cumulative rank to rates for workers in the lowest exposure category or with lower cumulative rank, respectively, using standardised rate ratios (SRR). We estimated 95% CIs using approximate methods and tests of linear trend for cumulative rank.8
Since long latency times have been observed for human urothelial cancers associated with exposure to aromatic amines9 we evaluated exposure lag periods of 10, 20 and 30 years, and time since first exposure. To account for differences between long-term and short-term workers, we calculated the SRR for the 10-year lagged cumulative rank quartile excluding workers with fewer than 90 days of employment or removing the first 90 days of follow-up for all other workers (effectively requiring minimum 90 days of employment).
Cox regression
Cox proportional hazards regression models were used to estimate bladder cancer hazard rates with estimated cumulative rank, adjusting for relevant confounders. In these analyses, age was the time variable, and all exposures were time-dependent. Since most bladder cancer cases were white males, controls were matched to cases within risk sets on gender and race in addition to attained age. All eligible controls were included, and the resulting matched risk sets were analysed with conditional logistic regression using the PHREG procedure in SAS (V.9.2, SAS Institute, Cary, North Carolina, USA) which is equivalent to a Cox proportional hazards model stratified on gender and race. Cumulative rank was treated as a continuous variable, and various transformations of cumulative rank were evaluated including square root, natural log and restricted cubic splines. Categorical models based on quartiles, quintiles or deciles of the cumulative rank distribution among all cases were also evaluated. Confounding by year of birth was evaluated by including appropriate terms in the regression model. Exposure lag periods of 0–30 years were evaluated and the best-fitting lag period was selected using the Akaike's Information Criterion (AIC).10 The proportional hazards assumption was evaluated by the likelihood ratio test for an interaction term between age and cumulative rank.
Smoking adjustment
Tobacco smoking information was available for a non-random subset that included 18% (n=334) of cohort members (T Carreón, unpublished data, 2013). The original analysis of bladder cancer incidence in this cohort2 considered an indirect method11 to adjust for confounding due to smoking. For this analysis, we considered more recent estimates for bladder cancer rate ratios with tobacco smoking. Furthermore, we used methods incorporating uncertainty regarding the amount of bias due to smoking using a Monte Carlo sensitivity analysis.12
Sensitivity analyses
The primary analysis used data from all cancer registries to identify cases. Life-table analyses were repeated considering alternative definitions of the catchment area, case ascertainment using death certificates and registries, and different assumptions for assigning state of residence. These analyses are reported in the online supplementary file.
Results
Characteristics of bladder cancer cases and non-cases are presented in table 1. We identified 52 bladder cancer matches from the six cancer registries: 38 malignant/invasive cancers and 14 urothelial carcinoma in situ, or non-invasive papillary urothelial carcinoma (fewer than five in this last category). All diagnoses occurred after starting work at the facility and 10 while still employed at the facility. After removing duplicates, 50 bladder cancer cases were eligible for analysis; however, cases diagnosed prior to 1976 were excluded from life-table and regression analyses, and those diagnosed after the study end date were treated as non-cases in these analyses. Of the remaining 46 cases, 20 had died as of 31 December 2007. The mortality study (T Carreón, unpublished data, 2013) identified four bladder cancer deaths through 2007, and all of these occurred in the registry states.
Characteristics of eligible workers, by case status
LexisNexis provided a median of two addresses per worker (range 1–18 per worker). Address years ranged from 1953–2007; only approximately 10% were from 1990 or earlier. Availability of LexisNexis addresses was substantially higher for workers alive at the end of the study compared to deceased and lost to follow-up workers (98%, 59% and 47%, respectively; χ2 p value=<0.0001). Considering all sources of address information, state of residence had to be assumed for 37% of the person-years-at-risk from 1976 to 2007.
Using all available address information, 23 workers never known to have lived in the catchment area were excluded from all analyses. Workers who left the catchment area prior to the study end date were censored (n=571, and nine cases diagnosed after first leaving the catchment area were excluded from the primary analysis); some of these workers (n=359) returned to the catchment area at a later date, but the primary analysis only considered the initial risk period.
External analyses
Among 1786 workers contributing 35 155 person-years-at-risk in the catchment, 37 bladder cancer cases occurred. Compared to the referent population, bladder cancer incidence was elevated (SIR 2.87, 95% CI 2.02 to 3.96). All 37 cases were diagnosed more than 10 years since first exposure. Bladder cancer was significantly elevated among workers with 20–<30 (SIR=4.20, 95% CI 2.29 to 7.05) and 30+ (SIR=2.65, 95% CI 1.62 to 4.09) years since first exposure, but not among workers with 10–<20 years since first exposure (SIR=1.99, 95% CI 0.41 to 5.83). No bladder cancer cases were reported (0.04 expected) among workers first employed after 1995 (n=25), when air monitoring data showed a reduction in exposure levels after company-implemented extensive engineering controls.
Compared to the referent population, bladder cancer incidence was highest among workers probably exposed (low and regularly) and definitely exposed (moderate/high) and workers with higher cumulative exposure rank (table 2). Among workers considered definitely exposed (moderate/high), bladder cancer incidence increased with longer duration of exposure and time since first exposure.
Observed and expected numbers of bladder cancer cases, SIRs, and directly standardised rate ratios among chemical workers, by exposure category
Internal analyses
Directly standardised rates of bladder cancer incidence significantly increased with quartile of cumulative rank in unlagged and 10-year and 20-year lagged analyses (table 2), but not using a 30-year lag period. The 10-year lagged cumulative rank quartile SRRs changed minimally when the the first 90 days of follow-up were excluded (1, 1.95, 3.81, 4.56; trend p value <0.0001).
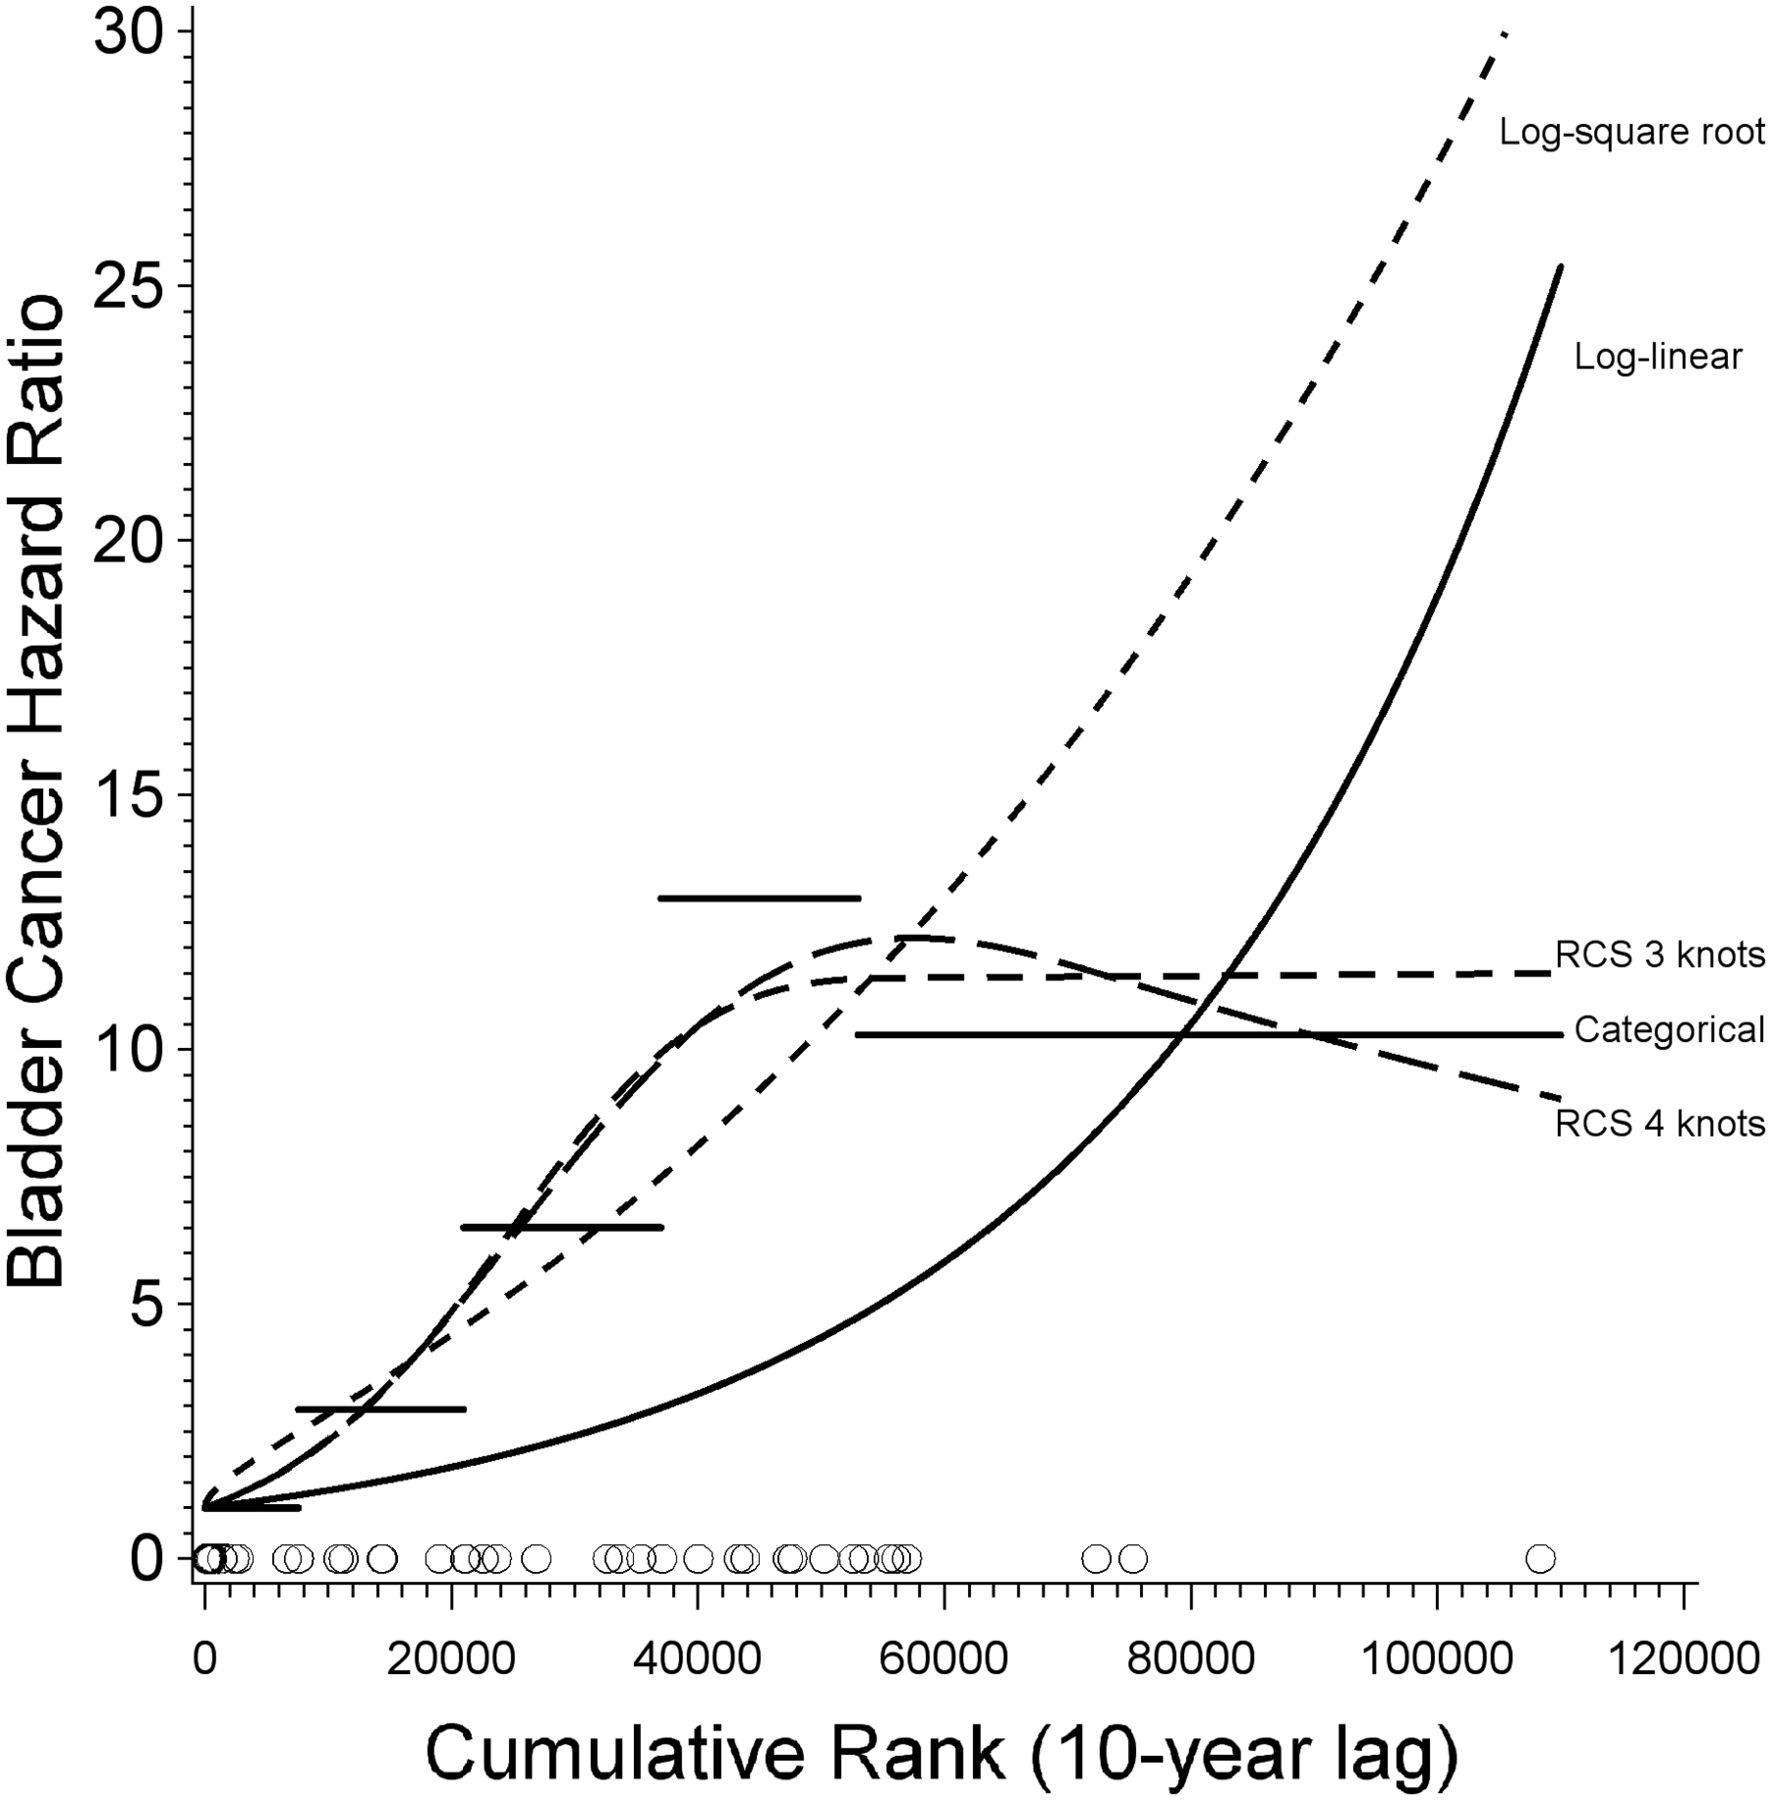
In Cox regression models, birth year did not confound the association between bladder cancer incidence and cumulative rank (results not shown). Exposure lag periods from 0 to 10 years provided similar model fits, assessed by the AIC statistic, but model fit diminished as the lag period exceeded 10 years (results not shown); consequently, all models incorporated a 10-year lag period. Cumulative rank was significantly associated with bladder cancer hazard rate in categorical models using quartiles, quintiles and deciles based on the exposure distribution among cases; continuous models including log-linear, log-square root and log-log (ie, power model); and restricted cubic spline models with three or four knots. Overall, the power model was best fitting based on the AIC statistic (results not shown), but since it produced unusually high HRs with very wide CIs, and did not agree with the categorical and restricted cubic spline models, it was discarded. The log-square root model, the next best fitting model based on the AIC statistic, produced estimates similar to those of the categorical and spline models. The log-linear model did not fit well, based on the AIC statistic and graphical inspection. Several of these models are summarised in table 3 and graphically illustrated in figure 1. There was good agreement among the categorical and restricted cubic spline models which indicated increasing bladder cancer with cumulative rank up to around 60 000 unit-days; a downturn in incidence was observed at higher cumulative ranks.
Cox regression models for cumulative rank (lagged by 10 years)
Bladder cancer HRs from different dose-response models including log-linear (solid curve), log-square root (short-dashed curve), categorical (based on quintiles of the case distribution), 3-knot restricted cubic spline (medium-dashed curve, with knots at the 10th, 50th and 90th percentiles of the case distribution), and 4-knot restricted cubic spline (long-dashed curve, with knots at the 5th, 35th, 65th and 95th percentiles of the case distribution). Open circles indicate the distribution of cumulative rank for bladder cancer cases (n=37). RCS, restricted cubic spline.
A significant interaction between cumulative rank and case age (categorised as less than the median case age of 60 years or older) in several models indicated a violation of the proportional hazards assumption (table 3); estimated HRs for cumulative rank were higher at ages younger than 60 years and lower at older ages. For example, based on the quartile model, the HR associated with the highest quartile compared to the lowest quartile was 8.94 (95% CI 3.57 to 24.6) in the simple model, but in the interaction model, the HR was 23.6 (95% CI 6.66 to 113) at ages younger than 60 and 2.46 (95% CI 0.64 to 10.0) at older ages. For the continuous log-square root model, the HR associated with 5 years of exposure at rank 10 was estimated as 4.11 (95% CI 2.39 to 7.23); estimates were 9.48 (95% CI 4.30 to 22.8) and 1.73 (95% CI 0.80 to 3.77) at ages younger and older than 60, respectively.
Smoking adjustment
The distribution of smoking in a subset of the cohort in 1987 (median year of smoking data) was 31.4% never, 26.9% former and 41.6% current smokers. The distribution of smoking among white males in the USA in 1987 (age-adjusted to the cohort) was 36.6% never, 29.9% former and 33.5% current smoker.13 Compared to never smokers, estimated rate ratios for bladder cancer of 2.1 and 3.4 for former and current smokers,14 respectively, produced an estimated bias factor of 1.08:
We estimated that smoking habit differences between the cohort and referent population would explain an 8% elevation in bladder cancer incidence in the cohort.
The smoking-adjusted SIR for the overall cohort was 2.67 with 95% Monte Carlo limits for the bias factor of 1.01–1.15, and for the smoking-adjusted SIR of 1.87–3.79.
Discussion
This study showed a near-threefold excess of bladder cancer among workers considered exposed to o-toluidine, aniline and nitrobenzene in a chemical manufacturing plant, when compared with the New York State population. We observed a fourfold increase in bladder cancer among workers probably exposed (low and regularly), and an almost fourfold increase among those definitely exposed (moderate/high). Increases in bladder cancer were observed with increasing cumulative exposure rank quartile in unlagged and 10-year and 20-year lagged analyses. In internal analyses, standardised rates of bladder cancer incidence increased with quartile of cumulative rank in unlagged and 10-year and 20-year lagged analyses. Cox regression models showed that the bladder cancer hazard rate was positively associated with the estimated cumulative exposure rank (lagged by 10 years) regardless of the treatment of cumulative rank (continuous or categorical).
In Cox regression models, the bladder cancer hazard rates increased substantially with cumulative rank among workers younger than 60 years, but less so among those aged 60 years and older. This finding was unanticipated, since more than two-thirds of bladder cancer cases in the USA occur at age 65 years and older.15 Since 1997, a company-sponsored bladder cancer surveillance programme has been in effect for plant workers who were exposed to o-toluidine and aniline in the course of their job duties. It is possible that this programme is contributing to early detection of cases that would have been diagnosed later (particularly carcinoma in situ, for which the test is relatively sensitive),16 which could explain the observed trends. In a cohort study of aluminium production workers, a non-statistically significant higher proportion of early stage bladder cancer at diagnosis was found after annual urine cytology screening was instituted than before the screening programme (77% vs 67%).17 In our study, only 11% of diagnoses prior to 1998 were carcinomas in situ compared to 48% of diagnoses in 1998 or later, and the difference was statistically significant ( =8.30, p=0.004).
Workers employed long term are different than short-term workers in terms of exposure and lifestyle.18 In this study, we did not observe bladder cancer cases among workers employed fewer than 90 days. Nonetheless, we conducted an analysis excluding the first 90 days of follow-up, and only minimal changes not affecting the conclusions were observed.
The results of our study corroborate earlier findings in this and other cohorts.2 ,3 ,19 ,20 Compared to the overall bladder cancer incidence estimate reported in the earlier study (SIR=3.64, 95% CI 1.94 to 6.23),2 the estimate reported in this study (SIR=2.87, 95% CI 2.02 to 3.96) is lower, but more precise. These results confirm an excess of bladder cancer among workers in the plant.
Study strengths include a lengthy follow-up and substantial person-time-at-risk. The identification of cancer cases at six different cancer registries minimised the likelihood of losing cases among former workers who might have moved out of the state. By linking to multiple cancer registries, we increased our case ascertainment by 22%. Internal analyses comparing workers by exposure level, allowed us to partially control for the healthy worker effect. The potential for differential information bias is low, as we developed relative ranks of exposure that considered all exposure information available. This allowed us to conduct exposure-response analyses, and show increasing bladder cancer incidence with increasing exposure.
Tobacco smoking is a well-known risk factor for bladder cancer.21 If the cohort smoking distribution differs from that of the referent population, then there is a possibility of confounding. Furthermore, cigarette smoke contains significant levels of several aromatic amines, including o-toluidine (0.4–144.3 ng/cigarette).22 We assessed the effect of confounding from smoking using an indirect adjustment method that considered smoking information available for a subset of the cohort. Since bladder cancer incidence due to exposures at the plant was much greater than the estimated incidence due to smoking, we have confidence that smoking is not the sole explanation of the observed bladder cancer excess.
In the mortality update, we reported four bladder cancer deaths (T Carreón, unpublished data, 2013), but the present study identified 50 bladder cancer cases. This finding underscores the need to conduct incidence studies for cancers with a low fatality rate such as bladder cancer. Buchanich et al23 documented the difficulties of conducting cancer incidence studies in the USA, where the lack of a central cancer registry leads to logistical complications when applying and matching cohort data to multiple-state cancer registries. Furthermore, the statistical methods are complicated due to differences in inception of the different cancer registries, and the likelihood that a case resides in a registry catchment area at the time of diagnosis. Bender et al24 studied cancer incidence among workers in two facilities in different states; they linked their cohort to the cancer registries in each of the states where the facilities were located, and counted a case if the residential history indicated that the worker was living in that state. In our study, we considered an individual to be in the catchment area if he/she resided in one of the states to whose cancer registry we had linked during the period that registry was collecting diagnoses. We did sensitivity analyses (see online supplementary file) to quantify the impact of alternative definitions of the catchment area and different assumptions for assigning state of residence. To fill out residence history gaps, we split them at the midpoint between two known addresses, which could lead to underestimation or overestimation of the person-years-at-risk. Alternative sensitivity analyses assigned the complete gap to the earlier or later state of residence. These assumptions did not substantially change our findings.
We reassessed and updated the exposure characterisation and used improved measures of exposure to o-toluidine, aniline and nitrobenzene. Previous exposure categories were based on department only, and did not differentiate between short-term and long-term exposure durations. By assigning exposure rank estimates based on department, job and year, and multiplying them by duration of exposure, we developed a cumulative exposure score for each worker's duration of employment.6 Industrial hygienists (KWH and SMV) blinded to the case status of the workers assigned exposure ranks to 225 department-job combinations, reducing the potential for differential misclassification of exposure.
Nevertheless, exposures to o-toluidine, aniline and nitrobenzene were concurrent.6 The antioxidant and accelerator manufacturing processes where these agents were used, were adjacent operations in the same buildings. Moreover, personnel records identified the department and job title for each worker, but did not specify whether the assignment was for the antioxidant or accelerator processes. Consequently, it was not possible to approximate workers’ exposures to each chemical based on assigned jobs and work histories. Thus, the ability to definitively distinguish the causative agent is not possible with this cohort.
We presume that exposure to o-toluidine is likely associated with the elevated bladder cancer incidence. Four historical cohort studies have consistently shown excess bladder cancer in o-toluidine-exposed workers; and o-toluidine induces tumours in experimental animals.19 ,1 Conversely, studies of workers exposed to aniline have not shown consistent evidence of increased cancer; aniline induces tumours in two strains of rat but not in other animal species. Consequently, IARC considers aniline as non-classifiable as to its carcinogenicity in humans (Group 3).19 ,25 No studies are available among workers exposed to nitrobenzene, but it has been shown to be a carcinogen in rats and mice; and is classified by IARC in group 2B (possibly carcinogenic to humans).26 Moreover, o-toluidine is a more potent animal carcinogen than aniline or nitrobenzene.27–29 Additionally, reviews of raw material data at the plant show that the amount of o-toluidine used was higher, and in a study conducted in a subset of workers, Ward et al30 observed that urinary o-toluidine levels and haemoglobin o-toluidine adducts substantially exceeded those of aniline.
Starting in the late 1970s, the company implemented a series of changes in the processes, engineering controls and work practices, designed to reduce chemical exposures. In 1990, NIOSH measured breathing zone air levels of o-toluidine (and aniline and nitrobenzene) in different processes throughout the Rubber Chemicals department; individual personal breathing zone o-toluidine concentrations ranged from 0.02 to 0.37 ppm, and geometric means ranged from 0.051 to 0.096 ppm. These measurements concur with those provided by the company for 1976–2004, and show a decrease in exposure concentrations over time.6 They also confirmed that exposure levels of o-toluidine were generally higher than those of aniline and nitrobenzene.
Our findings show that bladder cancer cases were still occurring among cohort members up to the study end date of 31 December 2007. To date, no cases of bladder cancer have been diagnosed among workers first employed after 1995. The importance of this finding is unclear due to the low number of new hires after 1995; the short latency time which has elapsed relative to bladder cancer incidence; and the low statistical power of the analysis.
We observed excess bladder cancer among all workers, except for those considered PNE. Likewise, increased bladder cancer incidence was observed even at the lower cumulative rank level. Air monitoring data showed that exposure concentrations even among the highest exposed workers were very low relative to existing occupational exposure limits.6 Currently, the Occupational Safety and Health Administration Permissible Exposure Limit (PEL) for o-toluidine is 5 ppm as an 8-h time-weighted average. The geometric mean levels measured by NIOSH at the plant were at least an order of magnitude lower than the PEL and the American Conference of Governmental Industrial Hygienists’ Threshold Limit Value of 2 ppm. The geometric mean levels of o-toluidine for samples collected by NIOSH were also lower than the most stringent exposure limit among European nations of 0.1 ppm set by Austria and Switzerland. The excess bladder cancer observed at the plant suggests that occupational exposure limits for o-toluidine may need to be re-examined, and that further measures, such as dermal exposure control/reduction, may be required. A future evaluation of the bladder cancer incidence among workers employed after 1995 would be necessary to identify if current exposure levels at the plant are adequate to prevent excess bladder cancer.
Acknowledgments
We wish to thank Kim Jenkins, Pi-hsueh Chen, Patty Laber and Kathy Waters for data preparation and programming support, Patty Reinhardt for assistance with cancer incidence and mortality data requests, and Yan Jin for her work on the smoking adjustment analyses. We are grateful to Tom Sorahan, Sara Wagner, Stella Koutros, Lynne Pinkerton, and 3 anonymous reviewers for helpful comments to the manuscript. We also thank the company workers, management and union employees for their valuable input.
References
Supplementary materials
Supplementary Data
This web only file has been produced by the BMJ Publishing Group from an electronic file supplied by the author(s) and has not been edited for content.
Files in this Data Supplement:
- Data supplement 1 - Online supplement
Footnotes
-
Contributors TC conceived the study and participated in design, data collection, analysis and manuscript development. MJH participated in design and analysis. KWH, SMV and AMR participated in design, data collection. All authors participated in the interpretation and presentation of results and have read and approved the final manuscript.
-
Funding This study was funded by CDC/NIOSH operating funds.
-
Competing interests None.
-
Disclaimer The findings and conclusions in this report are those of the authors and do not necessarily represent the views of the National Institute for Occupational Safety and Health.
-
Data use statement Cancer incidence data used in this study were obtained from the New York State Cancer Registry. Cancer incidence data used in this study were supplied by the Bureau of Health Statistics & Research, Pennsylvania Department of Health, Harrisburg, Pennsylvania. The Pennsylvania Department of Health specifically disclaims responsibility for any analyses, interpretation or conclusions. The collection of cancer incidence data used in this study was supported by the California Department of Public Health as part of the statewide cancer reporting programme mandated by California Health and Safety Code Section 103885; the National Cancer Institute's Surveillance, Epidemiology and End Results Program under contract N01-PC-35136 awarded to the Northern California Cancer Center, contract N01-PC35139 awarded to the University of Southern California, and contract N02-PC-15105 awarded to the Public Health Institute; and the Centers for Disease Control and Prevention's National Program of Cancer Registries, under agreement #U55/CCR921930-02 awarded to the Public Health Institute. The ideas and opinions expressed herein are those of the author(s) and endorsement by the State of California, Department of Public Health, the National Cancer Institute, and the Centers for Disease Control and Prevention or their contractors and subcontractors is not intended nor should be inferred. Cancer incidence data used in this study were obtained from the Ohio Cancer Incidence Surveillance system (OCISS), Ohio Department of Health (ODH), a registry participating in the National Program of Cancer Registries of the Centers for Disease Control and Prevention (CDC). Use of these data does not imply ODH or CDC either agrees or disagrees with any presentations, analyses, interpretations or conclusions. Information about the OCISS can be obtained at: (http://www.odh.ohio.gov/healthstats/ocisshs/ci_surv1.aspx). Cancer incidence data have been provided by the Texas Cancer Registry, Cancer Epidemiology and Surveillance Branch, Texas Department of State Health Services, 1100 W, 49th Street, Austin, Texas, 78756, USA, (http://www.dshs.state.tx.us/tcr/default.shtm), or (512) 458-7523. The Florida cancer incidence data used in this report were collected by the Florida Cancer Data System (FCDS) under contract with the Florida Department of Health (FDOH). The views expressed herein are solely those of the author(s) and do not necessarily reflect those of the FCDS or FDOH.
-
Ethics approval This study was approved by the NIOSH Institutional Review Board and the cancer registries of New York, Pennsylvania, California, Ohio, Texas and Florida.
-
Provenance and peer review Not commissioned; externally peer reviewed.