Article Text

Abstract
Aims: To examine the extent to which deindustrialisation accounts for long term trends in occupational injury risk in the United States.
Methods: Rates of fatal unintentional occupational injury were computed using data from death certificates and the population census. Trends were estimated using Poisson regression. Standardisation and regression methods were used to adjust for the potential effect of structural change in the labour market.
Results: The fatal occupational injury rate for all industries declined 45% from 1980 to 1996 (RR (rate ratio) 0.55, 95% CI 0.52 to 0.57). Adjustment for structural changes in the workforce shifted the RR to 0.62 (95% CI 0.60 to 0.65). Expanding industries enjoyed more rapid reduction in risk (−3.43% per year, 95% CI −3.62 to −3.24) than those that contracted (−2.65% per year, 95% CI −2.88 to −2.42).
Conclusions: Deindustrialisation contributed to the decline of fatal occupational injury rates in the United States, but explained only 10–15% of the total change.
- occupational injuries
- safety
- employment trends
- downsizing
- restructuring
- labour market
Statistics from Altmetric.com
The United States has enjoyed declining rates of fatal occupational injury since the 1970s.1–4 The reasons for this historical trend are not well understood, but possible explanations include efforts to improve workplace safety through voluntary and regulatory measures, indirect benefits from changes in work processes and products undertaken for other reasons, and a massive structural reorganisation of the economy sometimes known as “deindustrialisation”. This long term transformation has been characterised by transfer of investment from domestic manufacturing to other kinds of enterprises, leading to downsizing, relocation, and closure of manufacturing plants and accompanying reorganisation of the labour market. Over time, this process has led to contraction in the proportion of the labour force employed in manufacturing and a coincident expansion in service sector employment. Manufacturing employment in the United States has fallen from over a quarter of all jobs in 1970 to less than 15% in 2000, while the share of jobs in the service sector nearly doubled over the same period, from 16% to over 30%.5
Research on deindustrialisation tends to view it from two distinct perspectives. By some accounts, deindustrialisation is viewed as a necessary, and even beneficial, feature of modern capitalism. Disinvestment and reallocation of capital among sectors are seen as essential to growth in a dynamic, global economy and the resulting job losses and dislocations are viewed as transient phenomena without long term consequences.6
The opposing view is that deindustrialisation is cause for concern because of its potential for negative effects on workers and communities.7 The loss of well paying jobs associated with plant closures, layoffs, and the transfer of operations has been cited as a cause of numerous social and economic problems, including unemployment and underemployment, growth in income inequality, community decay, and crime.7–9
Both positive and negative consequences of deindustrialisation can be hypothesised with respect to workplace safety, in parallel with the effects postulated by social scientists. On the positive side, the shift of workers from manufacturing, where injury rates are relatively high, to jobs with lower risks could reduce the risk of injury for the average worker. On the negative side, decisions by shrinking firms or industries to forego maintenance and replacement of obsolete equipment, eliminate health and safety programmes, or attempt to increase per-worker output through overtime work could increase risk for workers who remain employed.
The health of unemployed workers in areas or industries undergoing deindustrialisation has been the subject of numerous studies, which suggest some deleterious effects on the mental and physical health of that group.10–13 A recent review of research on the health consequences of processes associated with employment shrinkage, such as downsizing and outsourcing, concluded that there is evidence of adverse effects on a diverse range of health indicators.14 There has been considerably less research on the “survivors” of deindustrialisation who remain employed in industries undergoing contraction, however. A study of hospital admissions around the time of the closure of a shipyard in Denmark suggested that hospitalisations for injuries increased among workers who remained employed in shipbuilding.15 In another previous study of employment and injury trends in North Carolina, we found evidence to support the hypothesis that injury rates may increase in industries undergoing contraction.16
Despite longstanding interest in deindustrialisation, its effects on workplace safety have not been thoroughly investigated. In the current study, we therefore examine the empirical support for both positive and negative effects of deindustrialisation on workplace safety in the United States through analyses of the relationship of trends in fatal occupational injury rates from 1980 to 1996 to structural reallocation of the labour market over the same period.
METHODS
Deaths from occupational injury that occurred in calendar years 1980–96 were identified through the National Traumatic Occupational Fatalities (NTOF) surveillance system, a database compiled by the National Institute for Occupational Safety and Health (NIOSH) using death certificates from the 50 states, New York City, and the District of Columbia. The standard death certificate used in the United States includes an item for the certifier to indicate the work relatedness of injury deaths: the NTOF system therefore includes all recorded deaths among persons age 16 or older attributed to an injury (International Classification of Diseases, 9th revision17 codes E800–E999) that the death certificate indicated was sustained “on the job”.18 Several categories of deaths were excluded from this study: homicide, suicide, intentionality unknown or pending determination, medical misadventure, non-work related choking on food or other objects, and non-occupational poisoning by therapeutic drugs or beverage alcohol.
Main messages
-
This study did not find evidence of a strongly negative or strongly beneficial effect of deindustrialisation on the rate of fatal occupational injuries in the United States, nationally or regionally, during the years 1980–96.
-
Although deindustrialisation was a factor in the long term decline of fatal occupational injury rates, it explained only 10–15% of the change over 17 years.
-
Other effects of deindustrialisation should be investigated both in future studies with a local or firm level focus, as well as by international research examining the effects of relocating production across borders.
-
Further research should be undertaken to examine the causes of the long term decline in fatal injury rates, including the effectiveness of deliberate intervention.
The remaining eligible deaths were tabulated by calendar year, industry, and geographic area. For industry, we collapsed the three digit US Census codes from the death certificate to form 48 industrial categories.19 Because discussions about deindustrialisation focus on the private sector, however, the public sector industry categories of Public Administration, Justice and Public Order, and Military Services were not included, leaving 45 categories, which were used in all of the analyses presented here. Note that while all 45 industry categories were used in the analysis of injury trends, workforce data were collapsed to seven broad sectors for more convenient display and consistency with standard reporting practices. Geographic areas were defined based on the United States Regions and Divisions defined by the Bureau of the Census.20
For each category defined by the preceding variables, we estimated the size of the workforce at risk from the 1980 and 1990 Census of population. A table of employment estimates with dimensions defined by calendar year, industrial sector, and geographic region (as defined above) was constructed. Intercensal estimates were derived via linear interpolation using the two decennial Censuses. In order to derive employment estimates for years after 1990, linear extrapolation was necessary because appropriate values from the 2000 decennial Census were not yet available. Merging the death data with the workforce estimates required exclusion of observations with invalid or missing data.
Year and industry specific rates of fatal occupational injury were calculated from the combined death and population data. To estimate the effect of deindustrialisation, we used the directly standardised rate ratio (RR). As a measure of the total change in injury rates over the 17 years of the study, we used the observed injury rates in 1996 (OR96) and 1980 (OR80) to compute the crude rate ratio cRR = OR96/OR80. To account for the effect of changes in the makeup of the labour force, the ratio of 1996 to 1980 injury rates was standardised to the distribution of employment in 1980. The hypothetical injury rate, ER96, that would have been expected in 1996 if the distribution of employment by industry had remained as it was in1980 was computed as: ER96 = ΣwiRi/Σwi, where Ri are the industry specific injury rates in 1996, and wi are weights equal to the proportion of the labour force in each industry category in 1980. The adjusted ratio (aRR) comparing the employment standardised rate ER96 to the crude rate observed in 1980 (ER96/OR80) is then a measure of the change in rates from the first to the last year of the study, taking into account differences in the distribution of employment.
Policy implications
-
This study did not find evidence to indicate that workplace safety should be a major consideration in formulating policy with regard to deindustrialisation.
As a check on the preceding analyses, which used data from only two of the 17 years of the study, we incorporated data from 1981–95 by computing analogous crude and employment standardised rates for each year and fitting conventional weighted linear regression models to these annual rates. The inverse variances of the rates were employed as weights in the regression.
In order to examine possible effects associated with shrinking employment, we compared fatal injury trends in industries that lost employment to trends in industries that kept pace with growth. Shrinking industries were defined as those whose relative share of employment in 1996 was at least 10% smaller than their share in 1980; those that remained were assigned to the comparison group of stable and growing industries. An industry’s relative share of employment was defined as the difference in the proportion of the workforce in that industry in 1996 versus 1980, divided by the proportion in the industry in 1980. We estimated trends in the rate of fatal occupational injury for the preceding two groups of industries by modelling annual injury rates as a function of calendar year using Poisson regression, as described in previous papers.4,21,22 The basic model had the form: log(rate) = β0+β1(year-1980), from which an estimate of the average annual proportional change in the rate of fatal injury can be obtained by exponentiating β1.
As an alternative to the preceding categorical analysis, we fit two types of regression models that treated the relative share of employment (defined above) as a continuous variable. In one model, we used weighted least squares linear regression to examine estimated 1980–96 trends in injury rates as a function of the change in the relative share of employment, the baseline injury rate in 1980, and the interaction of these terms. The response modelled in this analysis was the estimated trend coefficient for a particular industry sector (β1) with weights corresponding to the inverse of the estimated variance of this coefficient. In a second model, we used Poisson regression (without weights) to model the fatal injury rate in 1996 as a function of the same three predictors.
RESULTS
The study included 67 888 deaths from unintentional injuries on the job. For all of the United States, the 1996 rate of unintentional fatal injury at work was 2.99 per 100 000 worker-years, or 55% of the 1980 rate (cRR 0.55, 95% CI 0.52 to 0.57), representing a significant decrease (table 1).
Effect of changes in labour force structure on rates of fatal unintentional occupational injury in the United States, 1980–96
Substantial changes in the labour force also occurred during those years. While the total number of workers grew by 24%, the proportion of the workforce employed in manufacturing, agriculture, and extractive industries declined, while the proportion employed in services, retail, and construction increased (table 2). The expansion of the service sector was the driving force behind the growth of the workforce, accounting for 72% of the net increase in employment (table 2). Manufacturing suffered the largest losses of employment as measured by the number of workers, although the smaller agricultural and extractive industry sectors lost a greater share of employment relative to other sectors (table 2). Primary metal manufacturing, mining and oil production, tobacco products manufacturing, and apparel manufacturing had the largest declines in the relative share of employment, while business and repair services, warehouse storage services, personnel supply services, and agricultural services had the greatest growth (data not shown).
Changes in employment by industry sector from 1980 to 1996
Despite substantial changes, however, the shifting structure of the labour force explained a relatively small proportion of the reduction in the rate of fatal injury at work. After adjusting for labour force structure, the aRR for 1996 relative to 1980 was 0.62 (95% CI 0.60 to 0.65), a 12% change relative to the cRR of 0.55. Examination of these trends by region revealed some heterogeneity, with the Northeast experiencing a smaller 17 year reduction in injury rates than other regions and the West experiencing a larger reduction (table 1). Nevertheless, adjustment for employment structure changed the RRs by a similar amount, with values of aRR within 11–15% of the cRR in every region (table 1).
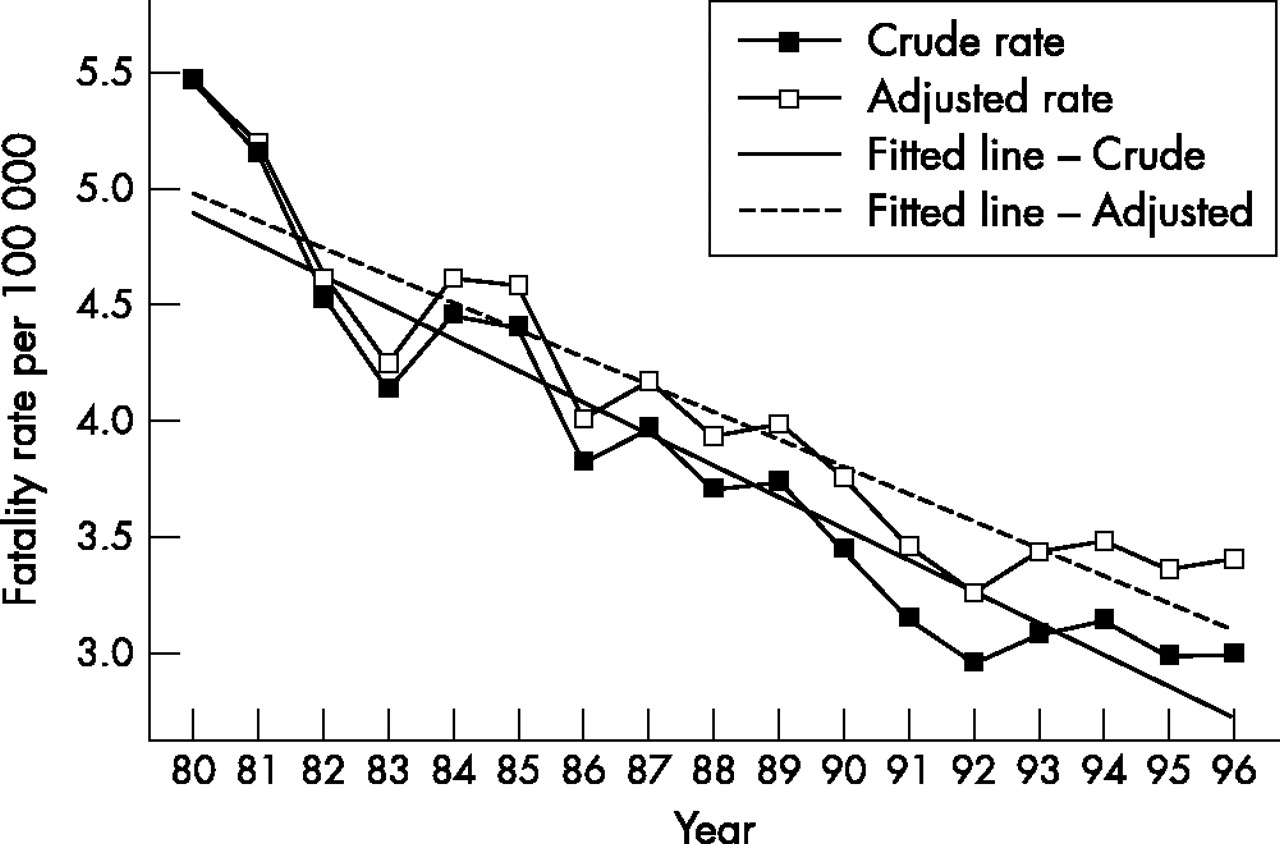
Fitting a linear model to annual estimates of the injury rate standardised to 1980 employment gave similar results (fig 1). The standardised national rate declined 0.118 deaths per 100 000 worker-years per year, while the crude rate declined more rapidly, at 0.137 deaths per 100 000 worker-years per year. The adjusted ratio (aRR) of the 1996 and 1980 rates estimated from the fitted model was 0.62, identical to the estimate obtained when only data from those two years were used.
Annual crude and employment adjusted rates of fatal occupational injury from 1980 to 1996, with model fitted trends in crude and adjusted rates.
When national trends were examined, industries that contracted had higher fatal injury rates at the beginning of the study period and their injury rates declined more slowly than those for expanding and stable industries, as hypothesised (table 3). Nationally, the rate of fatal unintentional injuries declined by 2.65% per year (95% CI −2.88 to −2.42) for shrinking industries, versus 3.43% per year (95% CI −3.62 to −3.24) for stable and expanding industries. Similar trends prevailed in the South and Midwest, but in the Northeast there was no significant change in the rate among shrinking industries, and in the West rates declined by a similar amount in both groups of industries (table 3).
Estimated rate of fatal unintentional occupational injury in 1980 and estimated annual trend in the injury rate for industries with shrinking versus growing or stable share of employment
Regression models treating change in the share of employment as a continuous variable did not fit the data well, but nevertheless yielded qualitatively comparable results suggesting that declining fatality rates were associated with growth in employment.
DISCUSSION
We estimated that the rate of fatal unintentional occupational injury for the United States declined by 45% from 1980 to 1996. Our findings further suggest that, if there had been no change in the structure of the labour force over that period, the injury rate would have declined by only 38%. This adjustment for changes in employment produced a 10–15% change, depending on the region of the country, in the RR comparing fatal occupational injury rates in 1996 versus 1980. These results can be interpreted as evidence that deindustrialisation may have accounted for between 10% and 15% of the improvement in fatal occupational injury rates.
These findings lend support to the hypothesis that the shift of workers from manufacturing to service and retail jobs helped to improve safety for private sector workers as a group. However, the quantitative results suggest that this beneficial effect was relatively small and that most of the improvement in the rate of fatal injuries would still have taken place if there had been no change in employment patterns. Previous studies in individual states have reported similar results.16,23
Such a reduction in the rate of fatal injury could have occurred as a result of deliberate interventions intended to improve safety or as an indirect benefit of other changes. New technology and labour processes are important to consider as factors that might contribute to lower injury rates in manufacturing industries. Automation and adoption of computer technology could affect injury rates both by reducing the number of workers engaged in production and eliminating hazards for those who remain. The export of production work to other countries could have similar effects. These explanations are not mutually exclusive, and more than one might operate simultaneously. Declining rates of fatal occupational injury could also be an artefact of external changes, such as an increase in under-reporting or improvements in trauma care. Under-reporting is unlikely to explain the trends, however, because awareness of occupational injuries increased over the study period and efforts have been made to standardise the ascertainment of on-the-job deaths.3,24 The potential effect of trauma care on the trends reported here is difficult to gauge directly. However, over two thirds of the workers who die from occupational injuries are dead at the scene or on arrival at hospital,25 so the potential for improved care to substantially reduce incidence may be limited.
The shift of employment from “high hazard” to “low hazard” industries in the United States was previously considered as a potential explanation for the decline in occupational injuries and illnesses by Conway and Svenson.26 They concluded that employment changes were not a major factor in the decline of officially reported injury and illness rates from 1992 to 1996, in part because some high hazard industries, notably construction, grew rather than shrank, and because injury and illness rates were higher than expected in some industries assumed to involve low levels of risk. Our approach was more formal and included only fatal injuries, but the results are broadly similar in that shifts in employment among industry sectors accounted for a relatively small share of the reduction in injury rates.
Deindustrialisation is a global phenomenon affecting many countries. Research in Brazil, for example, suggests a phenomenon similar to that observed in the United States: a prolonged decline in Brazil’s official rate of occupational injury occurred in concert with shrinkage in the share of the workforce employed in manufacturing and growth in service employment.27
Other research has suggested a positive association between the proportion of the manufacturing workforce unemployed and occupational injury rates.28,29 However, those studies considered the effects of short term business cycles rather than long term structural adjustments.
We observed that shrinking employment during the 1980–96 period was concentrated in the most hazardous industrial sectors, but we did not find support at the national or regional level for an increase in injury rates that could signal gross deterioration in working conditions in deindustrialising sectors. This finding contrasts with our previous study of occupational fatalities in North Carolina, where, in traditional manufacturing industries such as textiles, furniture, and tobacco products that contracted during the 1980s, the rate of fatal injuries increased by almost 10% per year from 1980 to 1990, whereas fatality rates declined in manufacturing industries undergoing expansion.16
Although we did not find increasing injury rates in any region, there were notable regional differences in the rate of decline. Both the lowest injury rates and the slowest declines in rates were observed in the Midwest and the Northeast; the latter region saw virtually no change in the injury rate among shrinking industries. Deindustrialisation began early in these areas,7 which became known as the “Rust Belt” for their decaying manufacturing plants. It is possible, therefore, that the study period did not include the years when the most important effects of deindustrialisation occurred in these regions.
Several limitations of this study should be recognised. The fatality rates may not be compatible with those reported elsewhere1–4 because of the exclusion of public sector workers and several causes death, including homicide. We identified occupational injuries from death certificates, which are the most comprehensive source of information available.30 Comparison of data from NTOF to the Census of Fatal Occupational Injuries, an active surveillance system established in 1992, suggests that the NTOF system captured over 80% of occupational injury deaths in the period 1992–95, with no bias in the pattern of deaths included.31 The completeness the NTOF system for earlier years has not been evaluated. Death certificates have other well known deficiencies with respect to the completeness and quality of the information they provide for each case.3,30,32–34 Although these problems have been extensively discussed, none of them affect the estimation of trends, as opposed to injury rates, unless their magnitude has changed substantially and systematically over time.
The data used to characterise the population at risk have related limitations. We assumed employment increased linearly between census years. If this assumption were substantially in error, rate estimates and regression models could be affected. Some other studies1,2 used annual workforce estimates from a survey conducted by the Bureau of Labor Statistics. While the annual nature of these estimates is an advantage, the small size of the sample is problematic for highly stratified analyses like those presented here. Other analyses we have conducted suggest that estimates of fatal injury trends derived using annual workforce estimates from the Bureau of Labor Statistics data are highly comparable to those reported here.
To quantify deindustrialisation, we used relative growth (or shrinkage) in industries’ share of employment. This indicator describes an important dimension of the phenomenon, but it may not capture changes that affect specific industries, individual firms, or workers themselves. In addition, the data did not include information concerning exposures or working conditions, so some questions of interest could not be addressed.
In conclusion, we did not find support for either a strongly negative or strongly beneficial effect of deindustrialisation on the rate of fatal occupational injuries in the United States at the national or regional level. For this aspect of workplace safety, at least, the role of deindustrialisation appears to be relatively neutral. Future studies with a local focus and firm or industry specific data could, however, be conducted to investigate whether injury risks increase for workers in downsizing industries or firms. The relative importance of deliberate intervention versus changes in processes and technology could also be investigated. International studies to examine the effects of cross-border relocation of production could also be instructive. In addition, further research should be undertaken to examine the causes of the long term decline in fatal injury rates.
Acknowledgments
This research was partially supported by grant number R01-OH03910 from the National Institute for Occupational Safety and Health. Eileen Gregory assisted with processing Census data and Steve Marshall provided statistical advice. Reviews of an earlier draft by Karl Sieber, Leslie Stayner, Suzanne Marsh, and Michael Schulman helped to improve the manuscript.
REFERENCES
Linked Articles
- Work in brief