Article Text

Abstract
Metabolites of pyrene and DNA adducts have been used as biomarkers of high level exposure to polycyclic aromatic hydrocarbons (PAHs). A systematic review was performed to evaluate whether these biomarkers are also valid markers of low level environmental exposure to PAHs. Thirty five studies were identified with more than 10 subjects that evaluated environmental air pollution to PAHs in relation to metabolites of PAHs, mainly hydroxypyrene (1-OHP), PAH-DNA adducts, or protein adducts. PAH metabolites and, to a less extent, PAH-DNA adducts correlated well at the group level with exposure to B(a)P even at low levels of air pollution. The use of these biomarkers should be more widely implemented in combination with more traditional techniques for the assessment of general population exposure to PAHs from ambient air pollution.
- air pollutants
- benzo(a)pyrene
- DNA adducts
- polycyclic hydrocarbons
- aromatic
- biomarkers
- B(a)P, benzo(a)pyrene
- PAH, polycyclic aromatic hydrocarbon
Statistics from Altmetric.com
Polycyclic aromatic hydrocarbons (PAHs) are a group of organic chemicals characterised by chemical stability, low volatility, and low solubility in water. PAHs are formed during the incomplete combustion of organic substances, are widespread in the environment, and typically occur in mixtures. Health damage associated with PAH exposure has been evaluated repeatedly by different health and environmental protection agencies, such as the International Agency for Research on Cancer (IARC), the Environmental Protection Agency (EPA), the National Toxicology Program (NTP), and the Agency for Toxic Substances and Disease Registry (ATSDR). Seven compounds, including benzo(a)anthracene, benzo(b)fluoranthene, benzo(j)fluoranthene, benzo(k)fluoranthene, benzo(a)pyrene, dibenz(a,h)anthracene, and indeno(1,2,3-c,d)pyrene, are considered by several agencies as human carcinogens.
The main sources of human exposure to PAHs are occupation, passive and active smoking, food and water, and air pollution.1 The total intake of carcinogenic PAHs in the general population has been estimated to be 3 μg/day.2 Levels of occupational exposure of benzo(a)pyrene (B(a)P), which is one of the main PAH compounds, vary widely in different industrial activities and job titles, ranging from 0.1 to 48 000 ng/m3.3–5 In smokers, B(a)P levels range from 0.5 to 7.8 μg/100 cigarettes when exposure is from mainstream smoke and from 2.5 to 19.9 μg/100 cigarettes when it comes from side-stream smoke. Levels from passive smoking are lower, ranging from 0.0028 to 0.76 μg/ m3 of B(a)P.6 Beside occupational exposure, dietary intake seems the most important source of PAHs in non-smokers; in the USA, dietary intake of total PAHs has been estimated to be almost 2 μg/kg food,6 with high levels of B(a)P found especially in charcoaled meat (8 μg/kg), while in a variety of other food products B(a)P levels from 0.09 to 30 μg/kg6,7 have been reported. Levels in water may range from 0 to 13 μg/l B(a)P. There is a high variation in atmospheric PAHs levels across geographical areas with B(a)P concentrations ranging from 0.01 to 100 ng/m3 B(a)P).8 Airborne PAHs are usually analysed by gas chromatography/mass spectrometry9,10 or high performance liquid chromatography,11–14 mostly from particles collected in a filter after extraction with organic solvents.
Pollution of air by PAHs is mainly due to the incomplete combustion of wood or fuel used for residential heating and industrial or motor vehicle exhaust.11 The level of exposure to PAHs through this source is low compared to other sources such as diet, occupation, or tobacco smoke. The half-life of airborne PAHs is of the order of days but can be longer when they are bound to small particles.2 In the cities where residential heating is the main source of PAHs, air pollutant PAH levels during winter are frequently higher than in summer.15–17 Nevertheless, some studies that found very low levels of B(a)P (range 0.03–3.3 ng/m3) did not show a seasonal variation.11
Inhaled PAHs are absorbed mainly through the bronchial epithelium. Absorption can be influenced by the size of the particles, with a slower clearance of those adsorbed on particles compared to PAHs in pure crystals.18,19 After absorption, PAHs are distributed to tissues where they are biotransformed by phase I metabolic enzymes to chemically reactive intermediates, that may bind covalently to DNA (DNA adducts), give rise to mutation and, eventually, tumour initiation. Furthermore, PAH metabolites are mostly conjugated with glucuronic acid by phase II enzymes and excreted as hydroxylated metabolites or in a small proportion as sulphate or even unconjugated. PAHs are excreted mainly through the faeces; only about 10% are excreted in the urine.
Main messages
-
Existing biomarkers for environmental exposure to PAHs correlate well at group level, with exposure to B(a)P even at low levels of air pollution.
-
This association is stronger for PAH metabolites, particularly hydroxypyrene, but is also observed for PAH-DNA adducts.
-
The use of these biomarkers when assessing environmental exposure at the individual level is limited.
The difficulty of finding an index substance arises from the fact that the composition of PAH mixtures depends on the combustion source. The most common compound used as a reference substance for carcinogenic PAHs is benzo(a)pyrene (B(a)P). B(a)P was the first PAH recognised to display carcinogenic activity; more importantly, it has a high carcinogenic potency and is present in all environmental media.
The most commonly used biomarkers of PAH exposure are metabolites of PAHs, particularly 1-hydroxypyrene, and PAH-DNA or protein adducts. 1-Hydroxypyrene (1-OHP) is the principal product of pyrene metabolism, representing 90% of its metabolites.20 Following inhalation, the half-life of 1-OHP is on average about 18–20 hours.21–23 Pyrene is the only known precursor of 1-OHP;24 it forms a consistent proportion of higher molecular weight PAHs in the environment.25 The two main analytical methods employed to measure 1-OHP are high performance liquid chromatography combined with fluorescence detection (HPLC/FD), and gas chromatography with mass spectrometry (GC/MS). For HPLC/FD, the detection limit is 0.05 μg/l, with a recovery rate of 85%,26 and for GC/MS it is around 0.1 μg/l with a higher recovery rate that reaches more than 93%.27 PAH adducts have been mainly employed as a measure of PAHs linked to DNA in target tissues (biological effective dose), although protein adducts have also occasionally been determined. The half-life of DNA adducts in lymphocytes is in the order of months, while for protein adducts it depends on the type of protein where the chemical is bound. In the case of albumin adducts, the half-life is around 20 days, while for haemoglobin adducts it is around 120 days. ELISA is used to measure specific DNA adducts, and 32P-postlabelling is used for the determination of bulky DNA adducts, also called aromatic adducts. Protein adducts are measured mostly in blood proteins using CG/MS, HPLC, or ELISA.
Studies examining PAH exposure through smoking or in the occupational environment have shown that at high levels 1-OHP and DNA adducts correlate well with B(a)P concentrations,28 whereas there exists less evidence on the correlation of PAH or B(a)P concentrations5 with protein adducts. In this review we evaluate whether these biomarkers are valid markers of low level environmental exposure to PAHs.
METHODS
Selection of studies
We reviewed all the studies which measured 1-OHP or adducts as biomarkers of exposure to PAHs in populations not occupationally exposed to these agents. We did not include studies on occupation, active and passive smoking, or diet since there already exist several recent reviews5,28,29 and also because the level of exposure is too high to be comparable with the levels of PAHs in air. A search in the electronic database PubMed for all papers published from 1980 to 2002 on PAHs biomarkers was conducted. The keywords used were “(benzopyrene OR pah OR pahs OR pyrene) AND (biological monitoring OR biomonitoring OR biological markers OR biomarker OR biomarkers)”. In addition, we checked our personal archives and examined the references of the papers identified.
Policy implications
The use of biomarkers of exposure to environmental levels of PAHs should be more widely implemented in combination with more traditional techniques for the assessment of general population exposure to PAHs from ambient air pollution.
In the first search, we found 723 articles that included both animal and human studies. We reviewed the abstracts and primarily selected 122 papers, after excluding animal studies, reviews, and human studies with less than 10 subjects. We further excluded studies on occupationally exposed subjects and two studies on environmental exposure to PAHs, because DNA adduct levels were presented in units non-comparable to those of other studies.17,30 Furthermore, five studies on 1-OHP were not included: two measured B(a)P metabolites instead of 1-OHP,31,32 two reported 1-OHP levels in units not comparable to the rest of the studies,33,34 and the fifth study focused on intra- and inter-individual variability of 1-OHP.35 Finally, we included 36 studies of DNA and/or protein adducts or metabolites of PAHs that referred to exposure to PAHs through environmental air pollution.3,7–9,11–13,15–17,27,36–61 In the selected studies, biomarker levels were presented for non-smokers or were adjusted for smoking, except for two studies that did not indicate if results were adjusted,12,38 and another study49 that did not adjust for smoking habits. Among the 19 studies analysing 1-OHP, 12 included non-smoking individuals. Eight studies on DNA adducts recruited only non-smokers, and five also had determinations on protein adducts.
Statistical analysis
We estimated between study differences and correlated mean biomarker levels with mean levels of B(a)P or the sum of eight carcinogenic PAHs in air (including benzo(a)anthracene, benzo(b)fluoranthene, benzo(k)fluoranthene, chrysene, benzo(a)pyrene, dibenzo(ah)anthracene, indeno(1,2,3-cd)pyrene, and benzo(ghi)perylene). The Pearson coefficient was estimated after log transformation of the mean values of benzo(a)pyrene in air and biomarker levels. Within study differences were also evaluated by comparing the mean biomarker levels in each study between exposed and unexposed (or less exposed) subjects. We did not perform a formal meta-analysis because studies were heterogeneous and did not allow a joint statistical evaluation. Heterogeneity between studies was tested through the Kruskal-Wallis equality of populations rank test that evaluates the hypothesis that several samples originate from similar populations. The p values of the t test were p = 0.028 for 1-OHP and p = 0.007 for DNA adducts, indicating that the levels of biomarkers in the populations evaluated were different. The application of statistical techniques to adjust for inter-laboratory variation in the adducts analysis, such as the calculation of the “frequency ratio” that models the within study differences in adducts,29,62 was not feasible due to the small number of studies and the heterogeneity in design between studies.
RESULTS
1-Hydroxypyrene
We identified 19 studies evaluating 1-OHP in relation to air pollution. Fourteen had environmental measurements of the B(a)P in air and urinary 1-OHP (table 1). Of the remaining five studies, two had no environmental data of any PAH,39,60 one measured the sum of 10 PAHs as a measure of exposure,27 another presented the sum of eight carcinogenic PAHs,61 and one measured only pyrene in air53. 1-OHP levels were not corrected for creatinine in two studies39,53 and these were not further considered. Of the 14 studies with air B(a)P and 1-OHP levels (expressed as μmol/mol creatinine), five presented biomarker levels of 1-OHP as geometric mean, two as the median, and the remaining eight studies presented mean levels. Geometric means were converted to arithmetic means when both the geometric mean and geometric standard deviation were available. We used the following formula63 that is based on maximum likelihood estimation, under the assumption of a log-normal distribution of environmental BaP64 and of 1-OHP concentrations:65 AM = GM*exp((0.5*(ln(GSD))2*((N−1)/N)), where AM = arithmetic mean, GM = geometric mean, GSD = geometric standard deviation, and N = number of subjects. Personal monitoring of B(a)P was done in five studies. In five other studies information on methods of determination of B(a)P was lacking.27,44,46,47,58 Levels of B(a)P exposure in the selected populations were in the range 0.10–64.5 ng/m3 and the levels of 1-OHP ranged from 0.01 to 3.39 μmol/mol creatinine.
Studies with B(a)P measurements in air and 1-OHP
Figure 1 shows within study differences in mean, median, or geometric mean 1-OHP levels of subjects exposed and unexposed to environmental PAHs. The figure includes all studies except those by Chuang and colleagues51 and Gundel and colleagues,44 because in these two studies the reference groups were smokers. In 15 of 21 pairs of data exposed subjects had higher levels of 1-OHP than non-exposed subjects, and in 10 of the 21 comparisons the difference were statistically significant. However, none of the studies found a statistically significant correlation between environmental exposure to PAHs or B(a)P and urinary concentration of 1-OHP at the individual level.
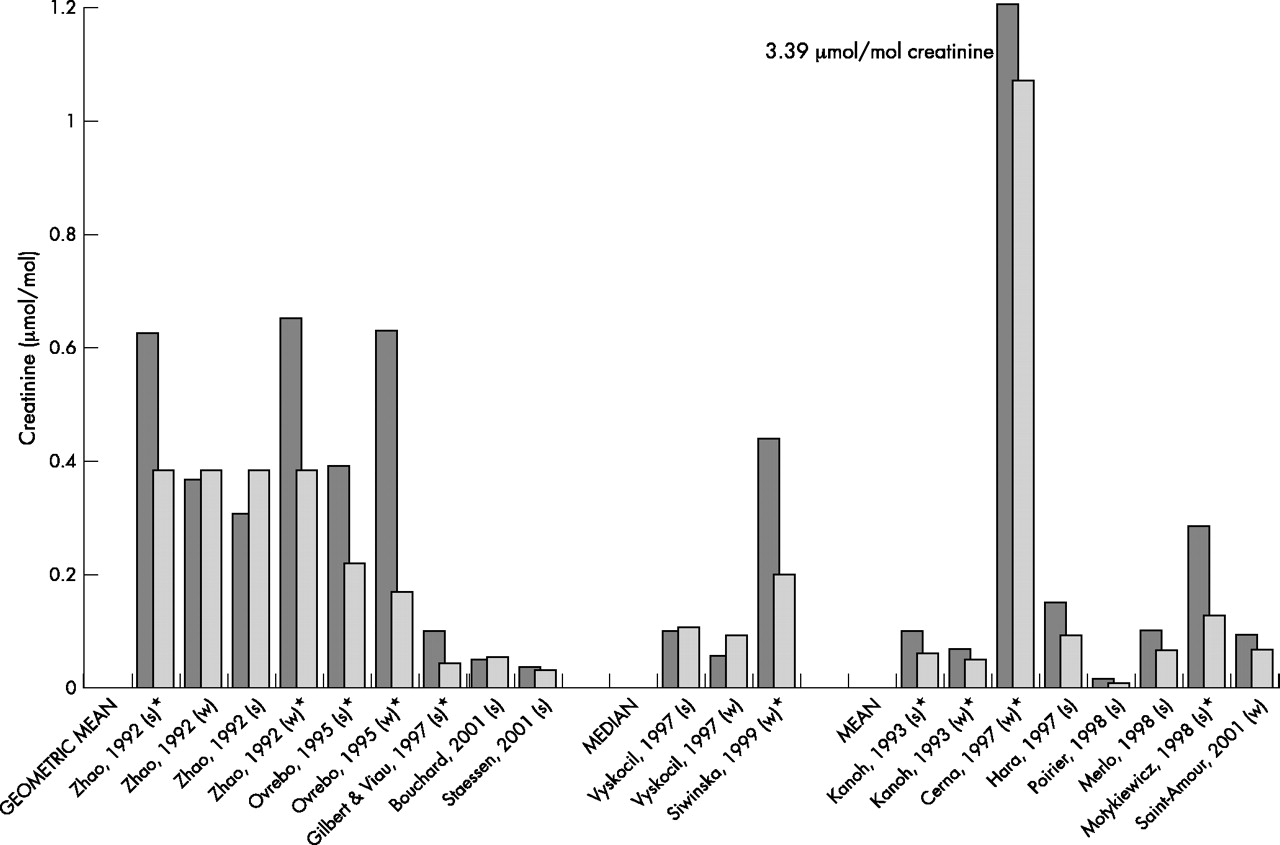
Comparison of levels of 1-OHP between exposed (dark bars) and unexposed (light bars) subjects environmentally exposed to PAHs. * Statistically significant differences between exposed and unexposed subjects in each pair of data. w, winter; s, summer.
When evaluating between study differences, a statistically significant correlation was found between the log transformed mean values of B(a)P and log transformed mean values of 1-OHP (Pearson correlation coefficient, r = 0.76; p < 0.001), on the basis of 17 pairs of data of B(a)P and 1-OHP. The Pearson correlation coefficient was higher when evaluating mean values of B(a)P and median values of 1-OHP (r = 0.83, p = 0.019, 7 pairs of data).
A higher correlation was found when the analysis was restricted to the four studies with personal sampling of B(a)P and presenting mean values for 1-OHP (r = 0.83; p = 0.040), compared to studies doing stationary monitoring (r = 0.70, p = 0.017) (fig 2). In this correlation we considered independently every pair of data of B(a)P and 1-OHP, and some studies contributed therefore with more than one estimate.

Correlation between environmental B(a)P levels and levels of 1-OHP in urine. (A) Pearson coefficient of natural log transformed values (p value). Personal monitoring and mean 1-OHP. r = 0.831 (p = 0.04). (B) Stationary monitoring and mean 1-OHP. r = 0.70 (p = 0.017).
DNA adducts
From the 17 articles on DNA adducts included, seven studies measured B(a)P in air,9,11,13,16,43,52,56,59 five studies reported measurements of other pollutants, either particulate matter or sums of different PAHs,12,41,45,49,61 and one study reported both B(a)P and sums of PAHs.13 The remaining four studies38,39,42,57 determined adducts but the exposure was defined using proxy variables, usually whether subjects lived in an urban or rural environment (table 2). Sampling of PAHs was done through personal monitoring in six studies, with only one study sampling B(a)P.11 The method used to determine adduct levels was mostly 32P-postlabelling, applying either nuclease P1 or butanol enrichment procedures. Most studies were performed during winter, with some studies having measurements both in winter and summer. One study52 found very high adduct levels compared to other studies in both exposed and unexposed subjects (table 2), and was not considered further.
Studies of PAH environmentally exposed subjects with DNA adduct measurements
In the 25 pairs of exposed-unexposed subjects measured in which adducts have been measured by 32P-postlabelling, 15 had higher DNA adduct levels in exposed compared to unexposed, whereas in 10 of the pairs unexposed subjects had higher levels (fig 3). In the three studies determining adducts using immunoassay, the exposed had higher levels than the unexposed in three of four pairs of data (fig 3). The mean DNA adduct level measured by immunoassay was 14.33 adducts/108 nucleotides, and by 32P-postlabelling 4.44 adducts/108 nucleotides. The mean airborne B(a)P levels were also higher in those studies using immunoassay (20.94 ng/m3 B(a)P) compared to levels in studies using 32P-postlabelling (8.67 ng/m3 B(a)P).

Comparison of the levels of DNA adducts, analysed by 32P-postlabelling and immunoassay in exposed (dark bars) and unexposed (light bars) subjects to environmental PAHs. * Statistically significant differences between exposed and unexposed subjects in each pair of data. w, winter; s, summer; n.a., information not available.
After log transformation of data for B(a)P levels in air and DNA adduct levels, the correlation between studies using stationary measurement of mean B(a)P in air and reporting mean DNA adducts was significant with a Pearson correlation coefficient of 0.60 (p = 0.038) on the basis of 12 pairs of log transformed BaP and adducts data from 3 studies (fig 4A). This correlation includes data points that are not independent since in some studies the same subjects were evaluated using both ELISA and 32P-postlabelling. The correlation coefficient was higher for analysis using ELISA (Pearson correlation coefficient r = 0.99, p = 0.019, 3 pairs of data) compared to 32P-postlabelling (r = 0.46, p = 0.209, 9 pairs of data) (figs 4B and 4C). One additional study43 reported median adduct levels and is not included in the graph or the correlations. Fewer studies reported results on personal B(a)P monitoring and DNA adducts, using median adduct levels (r = 0.53, p = 0.220, 7 pairs of data).

Correlation between stationary measured mean B(a)P levels in air and mean DNA adducts. (A) Scatterplot of natural log transformed values of mean DNA adduct levels and stationary monitoring of B(a)P (overall). Pearson coefficient: r = 0.60 (p = 0.038). (B) Adducts measured by ELISA. Pearson coefficient: r = 0.99 (p = 0.019). (C) Adducts measured by 32P-postlabelling. Pearson coefficient: r = 0.46 (p = 0.209).
Four studies12,13,59,61 and a pilot study41 measured the eight carcinogenic PAHs in air and determined adducts through 32P-postlabelling. One of these studies41 reported median adduct levels rather than means, and was not considered further. Mean PAHs levels by personal monitoring were 14.9 ng/m3 (range 1.62–72.9 ng/m3); mean DNA adducts was 2.54 adducts/108 nucleotides (range 0.92–5.59 adducts/108 nucleotides). The Spearman correlation coefficient between carcinogenic PAHs and DNA adducts was 0.617 (p = 0.077).
Protein adducts
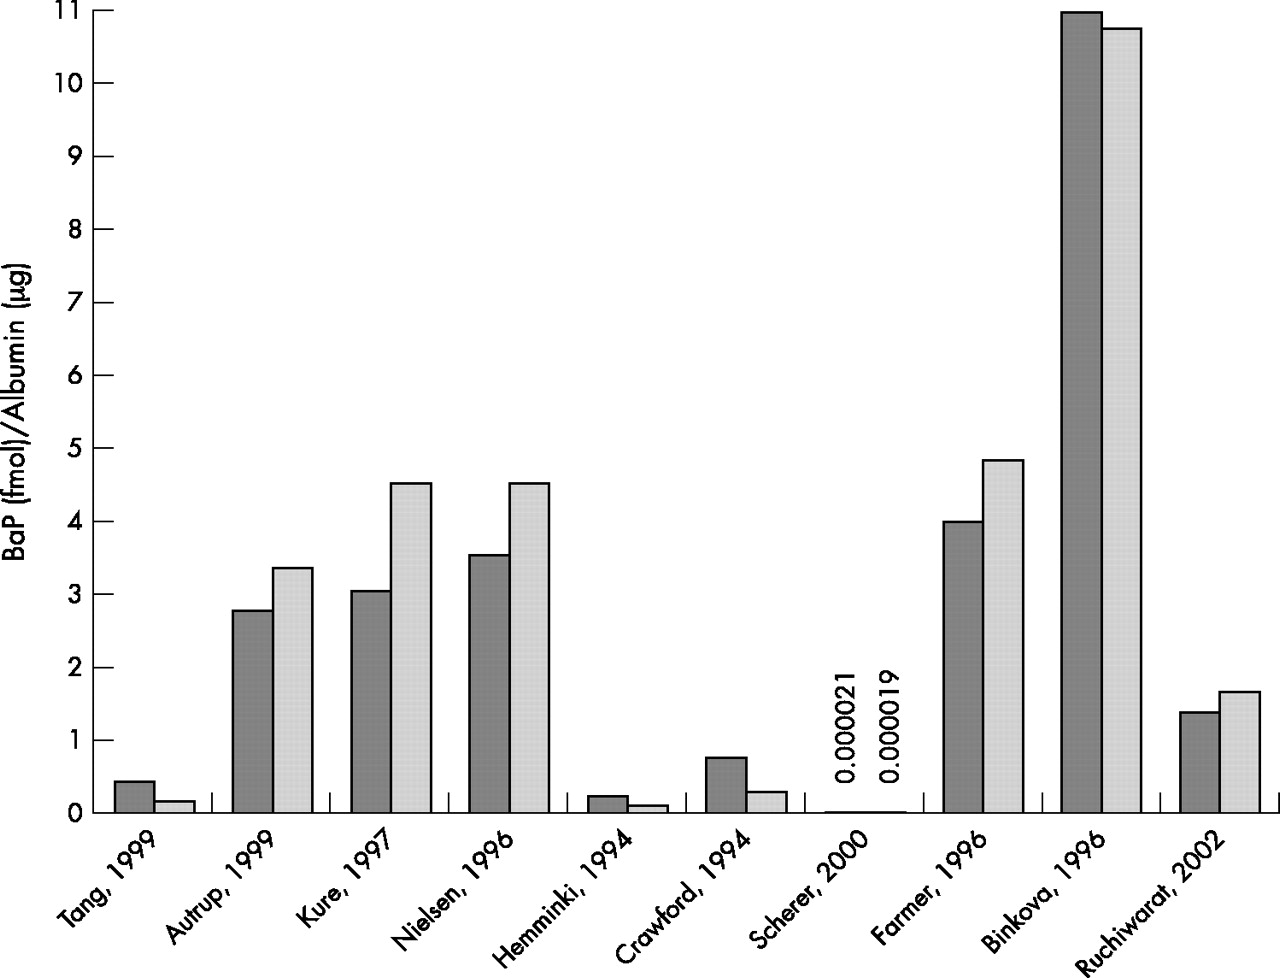
Nine studies determined albumin adducts using different techniques,13,15,55,39,40,43,45,52,61 one assessed BPDE-haemoglobin adducts,53 and another analysed both biomarkers.7 Albumin adduct levels in exposed subjects were higher than in unexposed subjects in five of these studies (fig 5), while in the remaining studies this relation was inverse. The mean albumin adduct levels in exposed was 2.75 fmol B(a)P/μg while in the unexposed subjects it was 3.04 fmol B(a)P/μg. Airborne B(a)P was only measured in two studies,15,52 while another study measured particulate matter,45 and another measured the sum of eight carcinogenic PAHs.61

Comparison of the levels of albumin adducts in subjects environmentally exposed (dark bars) and unexposed (light bars) to PAHs.
DISCUSSION
Studies on air pollution and health66 have focused on short term effects and have applied predominantly measures of exposure to ambient air pollutants. The use of biomarkers has focused on highly exposed populations, such as populations living in heavily exposed environments67 or occupational groups.68,69 Occupational studies and studies on active and passive smoking have reported positive correlations between B(a)P and some biomarkers, such as 1-OHP and PAH-DNA adducts,28 but in exposure situations where B(a)P concentrations were 10 to 100-fold higher than those normally found in ambient air concentrations. The use of biomarkers for evaluating low level environmental exposures has been limited and their use has not been generally accepted for the study of such exposures.70 In this review we showed that both PAH metabolites (1-OHP) and PAH-DNA adducts can be usefully applied to assess environmental exposure to PAHs at a group level. The correlation between environmental levels and 1-OHP was high in particular when personal monitoring of B(a)P was done, indicating that this biomarker can distinguish between fairly small exposure gradients. For DNA adducts the correlation, although statistically significant, was not as high and results were based on few studies. There was considerable heterogeneity between studies concerning methods used to measure exposure; for example, type of compounds measured and use of stationary or personal sampling, the methods used for biomarker determination, and the availability of information on confounders. These differences have probably resulted in an underestimation of the correlation between atmospheric PAHs and DNA adducts.
All the analyses presented are based on the correlation of mean levels of the environmental exposure and the biomarker levels. Individual levels would only be available if the raw data from each study were recovered and analysed. The overall variance in the populations studied is, therefore, underestimated in our analysis and this should affect the tests for statistical significance. It is, however, unlikely that comparison of mean values of both the exposure and the outcome has affected the main results since the slope of the correlation should not depend on the individual values within each study. What is more likely is that the slope we presented is an underestimate due to errors in the measurement of variables. The application of statistical techniques to adjust for inter-laboratory variation in the adducts analysis, such as the calculation of the “frequency ratio” that models the within study differences in adducts,29,62 was not feasible due to the small number of studies and the heterogeneity in design between studies.
PAHs in the air are present at concentrations from tens of ng/m3 in non-polluted or low-polluted areas to hundreds of ng/m3 in polluted areas. Most studies have used B(a)P as a reference substance for carcinogenic PAHs because this compound has a carcinogenic potency 10–100 times greater than many other PAHs. Nonetheless, the presence in the environment of other PAHs, some of which carcinogenic, does not allow an accurate estimation of the risk linked to a PAH mixture on the basis of B(a)P concentration alone. The major contributors to air PAHs in the urban and suburban atmosphere are mobile sources from diesel and gasoline engines. Emissions from these sources contain mainly benzo(g,h,i)perylene, pyrene, fluoranthene, and phenanthrene,71,72 so that measuring only B(a)P as an index substance may result in exposure underestimation.
High correlation coefficients were found between personal B(a)P measurements in air and 1-OHP levels, while the correlation was lower for PAH-DNA adducts. These results were less clear when comparing levels among exposed and unexposed subjects in a dichotomous way, and in a few studies higher levels of 1-OHP and PAH-DNA adducts were found among unexposed subjects. This is probably due to the smaller differences in level of exposure to PAHs within studies, compared to differences between studies. The correlation between studies indicates that differences as low as 5 ng/m3 of B(a)P measured through personal monitoring can be identified using these biomarkers. In several studies differences between exposed and non-exposed subjects were smaller than 5 ng/m3 and in one study those defined as unexposed had higher levels of B(a)P than those defined as exposed. The less clear pattern identified when comparing within study differences may also be due to the lack of adequate control of confounders in many studies. Smoking status of subjects was not specified in some studies, while dietary intake was not considered by the great majority of the authors, although diet has been shown to be the major contributor to the total intake of PAHs2 among non-smokers. Differences in the season of blood drawing may have been another factor affecting results. Air pollution originates in many cities mainly from residential heating and vehicle exhausts, and in general B(a)P levels in winter are higher than those measured during summer.16 This should be reflected in the adduct levels and could underestimate the correlation between PAH exposure and the level of biomarker in those cases where the levels of atmospheric pollutants were only an annual mean.16,44,47,73 These results point out the extreme importance of evaluating adequately both the biomarker and all the various potential environmental exposures to PAHs, since levels of these biomarkers reflect the exposure from many different sources.11,43,55,74 Dickey and colleagues75 estimated that 2.7 measures of PAH-DNA adducts should be determined to obtain the individual correct level in order to minimise intra-individual variability. Similarly, several measurements of 1-OHP are required for a reliable assessment of environmental exposure to PAHs.35
The analytical techniques used to measure adducts is another factor affecting results. Standardisation of 32P-postlabelling has been achieved by means of an inter-laboratory trial in 1999.76 This technique requires precision and several variations of the assay can be performed, which have been shown to produce very different results. These assay variations can explain some of the differences in DNA adduct levels measured by 32P-postlabelling. Higher adduct levels resulted from ELISA compared with 32P-postlabelling, although it is not clear if this was due to higher exposure to PAHs levels in studies using ELISA, or to higher sensitivity of the method. However, absolute comparisons between the two assays should only be made after calibration in a laboratory.
Protein adducts should, in principle, reflect the formation of DNA adducts.52 Results on protein adducts are, however, not consistent, although the number of studies analysed was quite small, compared to that of studies measuring DNA adducts. In addition, the techniques to measure protein adducts are still highly variable between laboratories, which complicates interpretation of results.
Biomarkers to assess exposure to PAHs at high levels are well studied, but more work is needed to validate these biomarkers when exposure occurs at low, environmental levels. At the group level, DNA adducts and particularly 1-hydroxypyrene seem to reflect exposure well, even at low levels of air pollution. By contrast, protein adducts do not appear yet as valid markers to assess environmental exposure to B(a)P. The use of these biomarkers should be more widely implemented in combination with more traditional techniques to evaluate effects of ambient air pollution.
Acknowledgments
Supported by a CIRIT grant no. 1999SGR 00241 (Generalitat de Catalunya) and by the FIS. We thank Francisco Fernandez for statistical assistance.