Article Text

Abstract
Objectives: To obtain knowledge on male reproductive toxicity of inorganic lead at current European exposure levels and to establish lowest adverse effect levels, if any.
Methods: A cross sectional survey of the semen of 503 men employed by 10 companies was conducted in the United Kingdom, Italy, and Belgium. The mean blood lead concentration was 31.0 μg/dl (range 4.6–64.5) in 362 workers exposed to lead and 4.4 μg/dl (range below the detection limit of 19.8) in 141 reference workers. Semen volume and sperm concentration were determined in a fresh semen sample according to an agreed protocol subject to quality assurance. The sperm chromatin structure assay (SCSA) was performed at a centralised laboratory. Extraneous determinants including centre, period of sexual abstinence, and age were taken into account in the statistical analysis. If appropriate, possible thresholds were examined by iterative threshold slope linear regression.
Results: The median sperm concentration was reduced by 49% in men with blood lead concentration above 50 μg/dl. There was no indication of a linear trend of lower sperm concentration with increasing blood lead values, but threshold slope least square regression identified a blood lead concentration of 44 μg/dl (β=−0.037, F=4.35, p=0.038) as a likely threshold. Abnormal sperm chromatin structure was not related to blood lead concentration, but some indications of deterioration of sperm chromatin was found in men with the highest concentrations of lead within spermatozoa. Biological monitoring data did not indicate long term effects of lead on semen quantity or sperm chromatin.
Conclusion: Adverse effects of lead on sperm concentration and susceptibility to acid induced denaturation of sperm chromatin are unlikely at blood lead concentrations below 45 μg/dl. Effects of low level exposure to lead on other measures of testicular function cannot be ruled out.
- lead
- semen
- sperm chromatin structure
- SCSA, sperm chromatin structure assay
- LOAEL, lowest observed adverse effect levels
- αT, metachromatic shift from green to red fluorescence, or the ratio of red to total (red+green) fluorescence
- EDTA, ethylenediaminetetraacetic acid
- ALAD, δ-aminolevulinic dehydratase
Statistics from Altmetric.com
- SCSA, sperm chromatin structure assay
- LOAEL, lowest observed adverse effect levels
- αT, metachromatic shift from green to red fluorescence, or the ratio of red to total (red+green) fluorescence
- EDTA, ethylenediaminetetraacetic acid
- ALAD, δ-aminolevulinic dehydratase
Several occupational surveys have linked exposure to inorganic lead with reduced sperm count and other signs of male reproductive toxicity,1–6 although these findings were not corroborated in a recent South African study.7 Most effects have been reported in men with blood lead concentrations above current regulatory thresholds of 50–60 μg/dl.2,4 The evidence in humans is supported by compelling evidence in mice, rats, and rabbits.8,9 The mechanism of male reproductive toxicity has not been characterised in any detail. It is not known whether the main mode of action is disruption of the hormonal regulation of spermatogenesis, direct toxicity to the seminiferous tubules, or both.
Because of declining concentrations of lead in industry and the environment in several countries,10–14 it has become a public health priority to obtain knowledge on male reproductive toxicity of inorganic lead at low levels of exposure and to establish lowest observed adverse effect levels (LOAEL), if any. Studies in rabbits indicate the existence of LOAEL for several indicators of testicular function,9 but the available human data do not allow quantitative exposure-response analyses of the low exposure range.
We designed an international study to examine male reproductive effects of inorganic lead at exposures up to 60 μg/dl blood. Sperm count (total sperm count and sperm concentration) in the ejaculate and susceptibility of sperm chromatin to in situ acid denaturation were selected for exposure-response and threshold analyses for several reasons. The strongest evidence on testicular toxicity of lead in human studies pertain to sperm count, and the rabbit model predicts an LOAEL of approximately 23 μg/dl.9 Moreover, the flow cytometric sperm chromatin structure assay (SCSA) provides a reliable measure of qualitative aspects of spermatogenesis in multicentre studies15 and effects on sperm chromatin structure have been reported in cynomolgus monkeys after exposure to inorganic lead.16 Finally, both markers of the male reproductive system have been shown to independently predict time taken to conceive in humans.17,18 Other measures of semen quality—such as morphology and motility—will be available for a subsequent report.
DESIGN AND POPULATIONS
The study is a cross sectional survey conducted by three European centres conforming to a standard protocol.19 We selected the workplaces for the study which had complete monitoring data on biological lead, an appropriate contrast with current exposure and as few associated toxic exposures as possible. Workers without occupational exposure to inorganic lead were recruited from other worksites in the same geographical regions (Italy and Belgium) or from within company departments without exposure to lead (the United Kingdom). During 1996–7 male workers currently employed at 10 companies in the United Kingdom (a battery company and a smelter), Belgium (a lead smelter and a university hospital), and Italy (two battery companies, three copper alloy foundries, and a private security company) were asked to participate in the study. Altogether 503 men corresponding to an average participation rate of 18% provided informed consent for participation (table 1). In the United Kingdom and Belgium workers were contacted by post, and in Italy workers were approached individually by a physician. This probably explains the great differences in participation rates between the three centres (table 1). Participants filled in a questionnaire on demographic characteristics, occupational and reproductive history, use of prescribed medicine, intake of alcoholic beverages, and smoking habits. The companies provided lists of biological monitoring data on earlier blood lead concentrations and a blood sample was taken to find the concentrations of inorganic lead at enrolment.
Participation in an international occupational semen study
Examination of semen
Among the 503 participants, 486 provided one fresh semen sample. The samples were collected by masturbation at home or at the hospital. We encouraged sampling after 2–5 days of sexual abstinence but emphasised that samples obtained at other times would still be useful if the exact abstinence period was recorded. The semen sample was kept in a pocket close to the body during transportation from the home to the laboratory. Here preparation of samples and semen analysis were performed by one trained investigator at each of the three sites. Almost 99% of the samples were analysed within 2 hours of delivery, and 61.3% within 1 hour. Semen volume and sperm concentration were measured immediately, and frozen samples were prepared for later centralised analysis of sperm chromatin structure.
The samples were kept in a heat chamber at 37oC for liquefaction for about 30 minutes. Semen volume was measured in a graded tube with 0.1 ml accuracy. Sperm cells were counted in a Neubauer chamber by the face contrast technique at a magnification of ×200. The sperm concentration was taken as the mean value of two counts showing a difference less than 10%. The total sperm count was computed as the sperm concentration multiplied by the volume of the ejaculate.
Flow cytometry
Abnormal chromatin structure of the spermatozoa—defined as an increased susceptibility to acid-induced denaturation in situ—was measured by flow cytometric measurement of red (denatured single stranded DNA) and green (native DNA) fluorescence in 10 000 sperm cells stained with acridine orange. A higher proportion of single stranded DNA was found in structurally altered as opposed to normally condensed sperm chromatin.21 The metachromatic shift from green to red fluorescence was expressed by αT, which is the ratio of red to total (red+green) fluorescence. In the sperm chromatin structure assay (SCSA), αT was calculated for each sperm cell in a sample and the result was expressed as the mean value (mean αT) and the SD of the αT distribution (SD αT). The proportion of sperm cells outside the main population was also calculated. Measurements of normal samples produce a narrow αT distribution with low mean αT concentrations, but samples containing sperm with increased susceptibility to DNA denaturation had high αT levels and a broader distribution resulting in higher SD αT and the proportion of sperm cells outside the main population.18,21 At the initial preparation of samples, 0.1 ml of semen was diluted 10-fold with a saline buffer solution containing 0.15 M NaCl, 0.01 M TRIS-HCL, 1 mM ethylenediaminetetraacetic acid (EDTA, pH 7.4), and 10% glycerol. Samples were immediately frozen at −80°C. At the end of the sample collection period, all specimens were shipped on dry ice to the Section of Toxicology and Biomedical Sciences at ENEA in Rome for analysis of SCSA, which was carried out according to the procedure described by Evenson et al with minor modifications.21 In brief, after thawing on crushed ice, cells were stained with acridine orange at 6 μg/ml and measured with a Facstar Plus flow cytometer (Becton, Dickinson, San José, USA).
Quality control
The investigators undertaking the on site analyses of semen samples, one at each centre, participated in a 2 day training course to standardise the analytical methods according to the protocol. Moreover, the technicians participated in an external quality programme within the Asclepios project.22 The coefficient of variation of sperm concentration between laboratories was 24.6%. The coefficient of variation between assays varied between 11% and 30.1%, and the coefficient of variation within assays from 9.6%–29.2%. The reliability of the sperm chromatin structure assay was also evaluated. For the mean αT, the coefficients of variation between and within assays ranged from 5.2% to 8.6% and 1.0% to 9.1%, respectively. For comp αT, the coefficients of variation between assays ranged from 9.3 to 22.3 and the coefficients within assays from 0.8% to 16.8%.
Assessment of exposure
Current exposure to lead was estimated from the concentration of inorganic lead in a venous blood sample taken when the fresh semen sample was received. All blood lead measurements were performed by atomic absorption spectrometry at the National German Reference Laboratory in Nürnberg-Erlangen.23 Among the 486 men providing a semen sample, blood lead could not be measured in 36. In 24 the lead concentration was below the detection limit; these men were assigned a blood lead value of 0.5 μg/dl corresponding to 50% of the detection limit around 1.0 μg/dl; and in 12 men with missing blood samples the lead concentrations were assigned the values of the most recent biological monitoring values within 4 years (seven men), the value determined at a local laboratory (one man), or the average site specific blood lead concentration in referents (four referents). Thus an estimate of most recent lead exposure was available for all the 486 men who provided a semen sample.
In a subset of 165 men (135 from Italy, 30 from the United Kingdom), the concentration of lead was measured in seminal plasma and spermatozoa by inductively coupled plasma mass spectrometry at the Department of Occupational Medicine, Brescia, Italy.24
Past exposure to lead was estimated from blood lead monitoring records obtained from the companies. Altogether 6979 blood lead values were available for 250 men, the number of values in each man ranged from 1 to 174. Monitoring data were available from 1967 in the United Kingdom, 1987 in Belgium, and 1980 in Italy. For each person, a measure of long term exposure to inorganic lead was computed by summing the average blood lead concentration in each of the calendar years during which the worker was employed. More than 2 years had elapsed between the most recent blood sample and the semen sample in 17 men and these were excluded from the analysis of long term effects. Biological monitoring data were not available during the first part of the working period for 140 men. The elapsed time between date of employment and the first blood lead sample ranged from 0.6 to 26 years (median 2.6 years). We extrapolated the individual long term exposure during these years from the yearly mean blood lead concentration in the 1st year when biological monitoring data were available. The median long term lead dose with and without extrapolated values were 403 μg/dl.years (range 11–2069) and 283 μg/dl.years (range 6–1414), respectively.
If exposure to lead below a critical concentration does not contribute to cumulative testicular toxicity, then 5 years of exposure at a blood concentration of 50 μg/dl might be more toxic than 10 years of exposure at a blood lead concentration of 25 μg/dl. To account for this potential bias, an additional measure of long term exposure was defined by summing the average yearly blood lead values above 40 μg/dl thus ignoring exposure below this level.
Statistical analysis
We analysed the relation between semen characteristics and current blood lead concentration with adjustment for several potential confounding factors. Using the same analytical principles, we examined subsets of participants for effects of current lead concentration in spermatozoa and seminal plasma and effects of long term exposure. The analysis focused on comparisons between groups, exposure-response relations, and possible threshold concentrations. Data on semen characteristics were transformed by the logarithmic function to approximate normality to obtain equality of variance across exposure categories as the distribution of all semen characteristics were skewed towards the left. We used Kolmogorov-Smirnov statistics for numerical tests of normality.25
The participants were divided into six groups of current concentration of blood lead defined by a 10 μg/dl interval scale. For the other exposure measures, categories were chosen that divided the participants roughly by quartile of exposure. The distributions of outcome variables in each group were summarised by median values for reasons of comparability with other studies and by geometric means corresponding to the statistical analysis of logarithmic transformed variables. Using analysis of variance (ANOVA), the distributions of semen characteristics in each of the groups with blood lead higher than 10 μg/dl were compared with the baseline group with blood lead less than or equal to 10 μg/dl. Adjustments for effects of covariates were performed by multiple linear regression on the logarithmic scale (PROC GLM, MEANS option26). The adjusted geometric mean values were obtained from the adjusted mean values by the exponential function. This approach is robust to non-linear relations between semen characteristics and blood lead, but the results may depend on the arbitrary cut off values defining the grouping. Therefore, in a second series of analyses, we examined the relation between semen characteristics and measures of exposure (continuous variables) by least squares linear regression.26 If the linear regression showed a significant relation between semen characteristics and exposure variables or if comparisons between groups indicated an exposure response pattern, we performed iterative threshold-slope linear regression to identify thresholds of the exposure variable below which no effects are detectable27:
sperm characteristic=α+β*(leadcurrent−lead threshold),
where leadcurrent was set to the leadthreshold value if the blood lead was equal to or less than the threshold.
By shifting the threshold value through all integer values in the interval from 11 μg/dl to 60 μg/dl in 50 iterative regressions (in case of current blood lead analyses), the most likely threshold, if any, was given by the model with the most highly significant F value. Essentially, the threshold is the exposure level at which a non-zero slope of the line becomes best fitted to the data.
We also examined the prevalence of semen values below or above preset cut off levels based on rounded values of the 25/75 distribution percentiles. Prevalence odds ratios (ORs) and associated 95% confidence intervals (95% CIs) were computed by logistic regression to estimate the risk of having an abnormal semen value by exposure level.
The following covariates were included in the analyses regardless of the strength of the association or level of significance: centre (Italy, Belgium, or the United Kingdom), age (>45 years or ≤45 years), smoking (yes or no), smoking marihuana in the past 3 months (yes or no), intake of alcoholic beverages (0–9 a week, 10–19 a week, or more than 20 a week), period of sexual abstinence (the logarithm of days), season (May-October or November-April), fever exceeding 38oC during the past 3 months (yes or no) and genital disorders (yes or no, table 2).19 The fit of the regression models were checked with a plot of residuals by predicted values. In the case of outlying values, analyses were repeated excluding outliers to check if results were strongly influenced by a few observations.
Characteristics of semen providers by current blood lead concentration
RESULTS
The mean (range) blood lead concentration in the 362 workers in industries with exposure to lead was 31.0 (4.6–64.5) μg/dl. The corresponding figure for the 141 workers in the reference industries was 4.4 (below detection limit to 19.8) μg/dl. Across all companies, the workers with high blood lead concentrations had, on average, a higher age, a larger proportion of current smokers, and a higher weekly consumption of alcoholic drinks, but the prevalence of genital disorders was lower. The body mass index was similar in the groups (table 2).
Men with high blood lead concentration had, on average, a slightly longer period of sexual abstinence whereas season of sampling, spillage, fever within the past 3 months, and the interval from sampling to semen analysis were not systematically related to blood lead concentration (table 3).
Semen sample characteristics in semen providers by current blood lead concentration
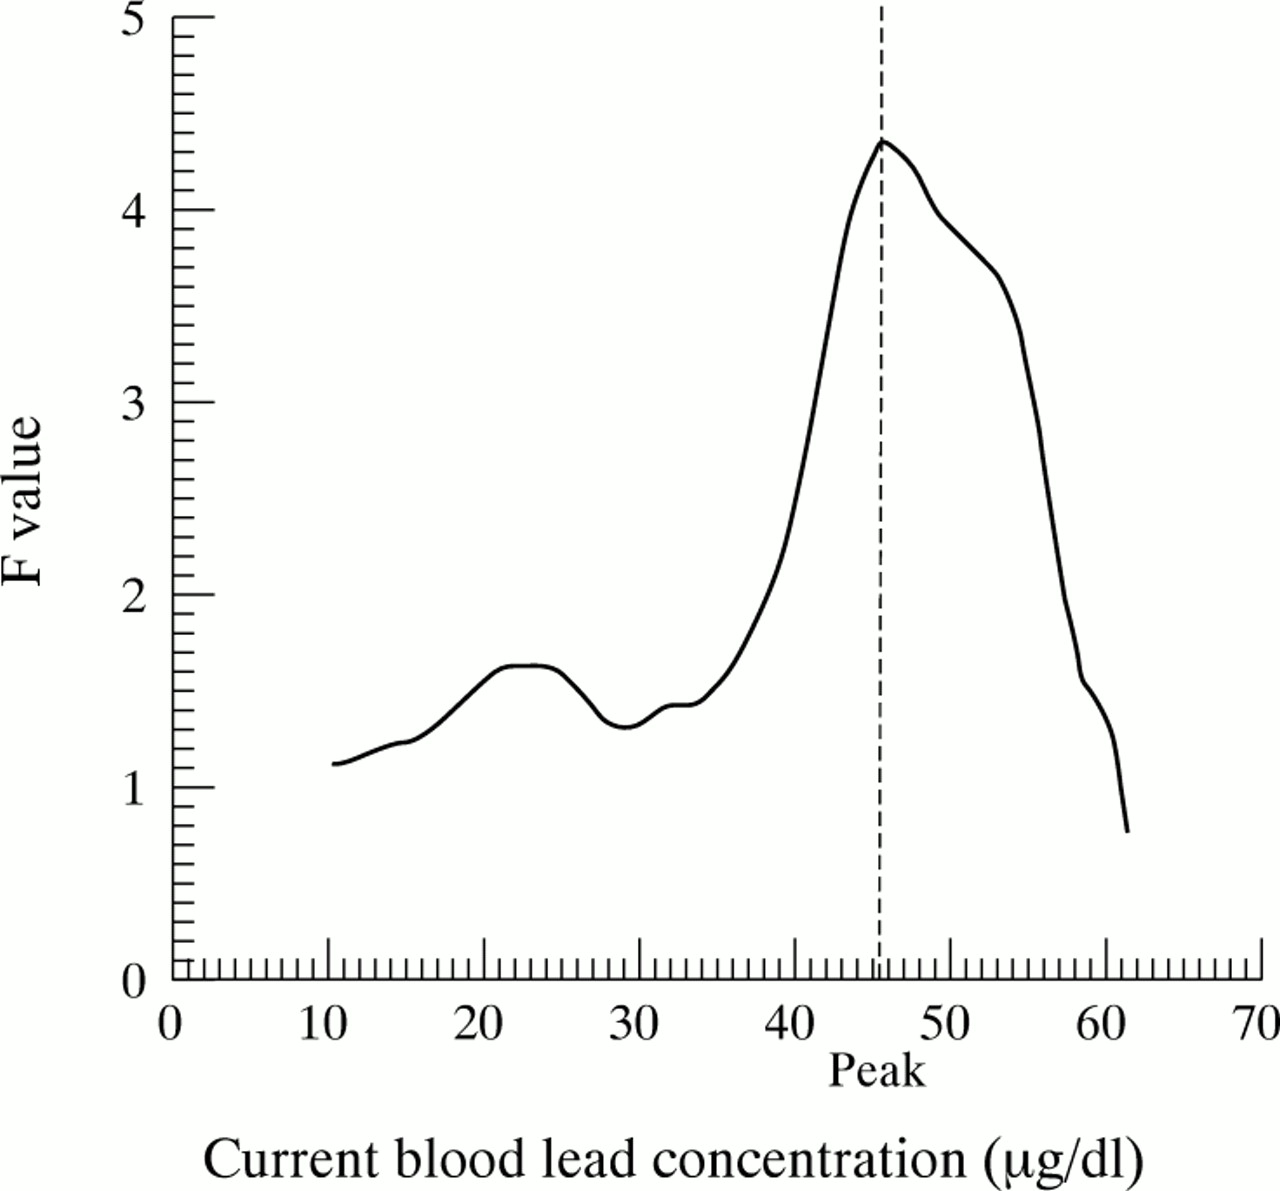
The semen volume was slightly lower in the groups with current blood lead higher than 10 μg/dl, but no trend was found (table 4). The median sperm concentration was reduced by 49% in men with blood lead concentrations above 50 μg/dl compared with the baseline group with blood lead concentrations below 10 μg/dl (table 4). Least square regression did not indicate a linear trend of lower sperm concentration with increasing blood lead values. However, both the crude and the adjusted geometric mean of the distribution of sperm concentrations were significantly reduced in the highest exposure group. Taking this as an indication that lead in the high end of the exposure range may reduce sperm concentration, we used iterative threshold-slope least square regression to identify a threshold—if any—for reduced sperm concentration. The F values peaked at 44 μg/dl (β=−0.037, F=4.35, p=0.038) pointing to this value as the most likely threshold (fig 1).
Semen quantity and quality by current blood lead concentration (median (range), crude and adjusted GM)

The distribution of F values in 50 threshold-slope linear regressions of sperm concentration on current blood lead concentration. The blood lead concentration corresponding to the highest F value is the most likely threshold below which lead has no detectable adverse effect on sperm concentration.
Similarly, least square regression of total sperm count on blood lead concentration was not significant (table 4), but the median total sperm count in men with current blood lead values above 50 μg/dl was 58 million compared with 128 million in the baseline group, with a significantly reduced geometric mean (table 4). The threshold-slope analysis showed a peak of F values at 53 μg/dl (β=−0.117, F=4.10, p=0.043) as the best estimate of a threshold.
Although the risk of having a sperm concentration below 20 million/ml or a total sperm count below 50 million was not increased in men with current blood lead up to 50 μg/dl, men with lead concentration above this value had an increased risk (table 5).
OR (95% CI) of reduced semen quantity and quality by current blood lead concentration
None of the measures of damage to the sperm chromatin structure showed any relation to current blood lead concentration and even the highest exposed group had SCSA values completely in the range of the baseline and low level exposure groups with the possible exception of SD αT (table 4).
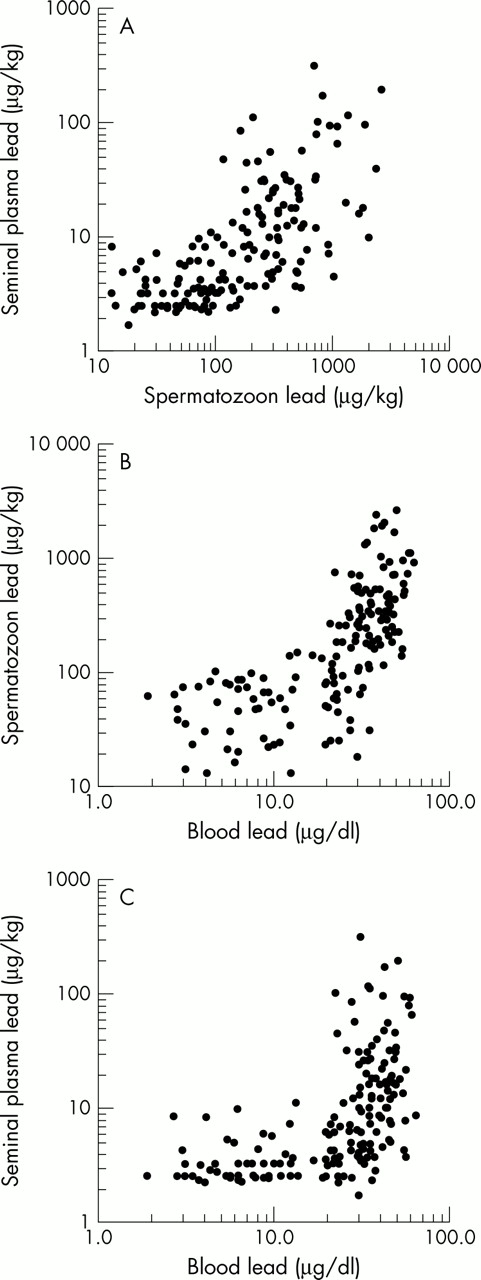
The extracellular concentration of lead in seminal plasma was on average 19 μg/kg (n 167, SD 37, median 6.1) which is many times lower than the intracellular concentration in spermatozoa (mean 320 μg/kg, SD 440, median 169). The mean concentration of blood lead in the same subset of workers was 28 μg/dl (SD 16, median 30.2) thus overlapping the lead concentration in spermatozoa. The lead concentrations in blood, seminal plasma, and spermatozoa were highly correlated (fig 2). The correlation coefficients for the concentrations of lead in blood and sperm cells were 0.70 (p<0.0001), for lead in blood and seminal plasma 0.56 (p<0.0001) and for lead in sperm cells and seminal plasma 0.68 (p<0.0001). In the subset of 165 men with semen lead measurements, we found roughly the same relations between blood lead and semen characteristics as in the entire group. But by contrast with the findings in the blood lead analysis, we found a significant decline in semen volume and total sperm count but not in concentration of lead in semen with increasing concentration of lead in spermatozoa (table 6). Although no trend between sperm lead and the SCSA variables was found, the geometric mean of the mean αT was increased in men with the highest sperm lead concentrations (table 6). Similar analyses of the concentration of lead in seminal plasma showed much weaker associations (data not shown).
Crude and adjusted GM (SE) of semen characteristics by concentration of lead in spermatozoa
Scatter plots of the concentration of lead in seminal plasma and spermatozoa (top panel), spermatozoa and blood (centre panel), and seminal plasma and blood (bottom panel) in a subset of 165 industry workers. All correlations are highly significant.
Finally, we found no indication that any of the measures of semen quantity and quality were related to the long term measure of exposure to lead in the subset of 250 men where biological monitoring data were available (table 7). The same results were obtained by substituting the long term measure based on extrapolated blood lead values in early years with a measure based on the observed values only and by an analysis only taking blood lead values above 40 μg/dl into account.
Semen values and sperm chromatin structure assay variables in 250 men according to the sum of the yearly mean blood lead concentration during all years of employment (median (range))
DISCUSSION
This study indicates no effect of inorganic lead on sperm concentration and sperm chromatin structure at blood lead concentrations up to about 45 μg/dl and provides some support for an effect on sperm concentration and total sperm count at exposures above 45 μg/dl. It should be acknowledged, however, that the number of highly exposed workers was small and chance findings are not entirely unlikely.
The findings were consistent across the three centres and the sample size was higher than in earlier studies which strengthens the findings. But the low participation rate at two of the three sites is a major limitation conferring risk of selection bias as men who perceive themselves to be less fertile may be more motivated to take part.28,29 However, an analysis of time to conception of the most recent child in participants and non-participants in the United Kingdom sample did not indicate that the semen study participants had a higher prevalence of infertility (table 8); however, this analysis may not reflect the fertility when the workers made up their mind whether to participate or not. Moreover, other indicators of male subfertility did show a trend towards higher participation of subfertile men (table 9). An analysis of participation by the most recent blood lead value in a subset of 313 eligible men in the United Kingdom sample did not indicate any impact of exposure level on willingness to sign up for the study (data not shown). Nevertheless, as we do not have complete data on exposure level as well as fertility in the entire source population, we are not able to rule out the potential importance of selection bias due to differential participation related to both exposure and fertility. Yet consistent findings across centres makes this less likely. Moreover, findings in analyses of the Italian sample, characterised by a high participation rate and of the subset of workers that excluded the external referents, corroborated the main results.
Time taken to conceive the most recent child* (n (%)) by semen study participation in England
Subfecundity by participation in the United Kingdom sample
Results of semen analyses may not be comparable across different centres. A training course and an external quality control programme were important measures to ensure reliable data on semen in this study. The median sperm concentration were the same at the three centres (47 million/ml at all centres). Moreover, the data clearly showed the well known positive relation between period of sexual abstinence and sperm concentration30 and the expected inverse relation between period of abstinence and the SCSA variables.15 Therefore we think that results of the sperm counting and the SCSA assay are valid and reliable.
The concentration of inorganic lead in blood may not reflect the concentration in the target organs and therefore we measured lead in seminal fluid and its fractions which might be better correlated with testicular lead and histopathological alterations.31,32 The high content of lead within spermatozoa and the low concentration in seminal fluid found in this study indicate that lead is either taken up by spermatozoa or is built into the sperm cells during spermatogenesis. The analyses based on lead in semen largely corroborated the findings based on analysis of lead concentration in blood but men with the highest concentration of lead in spermatozoa also had higher mean αT and proportion of sperm cells outside the main population, indicating alterations of the sperm chromatin structure. Cynomolgus monkeys with mean blood lead concentrations of 10 μg/dl and 56 μg/dl after treatment with lead acetate from birth to the age of 15–20 years had increased sperm chromatin SD αT and proportion of sperm cells outside the main population compared with a reference group (blood lead less than 1 μg/dl). Mean αT values were not reported.16 It has been proposed that lead either affects DNA synthesis in precursors of the spermatozoa or interferes with the normal replacement of nuclear histones by cysteine rich protamines during sperm chromatin condensation. Lead has been shown to bind firmly with thiol groups present on cysteine residues in protamines—perhaps in competition with zinc as suggested by Foster et al.16
Moreover, in humans zinc contributes to sperm chromatin stability and binds to protamine P2. It has recently been shown that lead competes with zinc and binds human protamine 2 causing conformational changes in the protein.33 This decreases the concentration of DNA protamine 2 binding which probably results in alterations in sperm chromatin condensation. Alteration of sperm chromatin structure by increased in situ denaturation is strongly correlated with the presence of sperm DNA strand breaks20 and is associated with reduced fecundity in humans.18
Several other studies have reported effects on testicular function in men with group mean blood lead concentrations above 40–50 μg/dl.1–4 These results are consistent with a likely threshold of about 45–55 μg/dl below which no adverse effects on semen quality could be detected in this study. However, a recent semen study in 97 men employed in a South African lead acid battery plant did not give support to an effect of lead on sperm concentration and total sperm count.7 The current blood lead concentrations ranged from 28 to 93 μg/dl, but the number of workers with low blood lead values were small. A limited exposure contrast is, therefore, a likely explanation of the negative findings in the high exposure range in that study. Telisman et al recently reported a dose dependent decrease in sperm concentration as a function of blood lead concentration in a cross sectional sample of 98 lead workers and 51 referents.5 There was no indication of a no effect threshold in these data. As the dose-response relation was not found within the group of lead workers, the overall findings may reflect differences between exposed and referent workers which are not related to exposure to lead. However, the study by Telisman et al did show a dose-response relation between δ-aminolevulinic dehydratase (ALAD) activity in blood and sperm concentration within lead workers—a finding which unfortunately cannot be corroborated or refuted by the present study, which did not include ALAD measurements. Consistent with the findings in our study, a longitudinal study of Danish battery workers found no improvement of sperm concentration along with a decline in blood lead concentration from about 40 to 20 μg/dl.6
Main message
-
The results of an international study of semen quality in industrial workers exposed to lead are reassuring. The current exposure concentrations in the United Kingdom, Belgium, and Italy seem not to impose a high risk to male fertility, but workers in the highest exposure range may be at risk even if the occupational exposure limit values are not exceeded.
Policy implications
-
Current occupational threshold limit values in seveal European countries should be reassessed as they are above the likely treshold for male reproductive toxicity of 44 μg/dl lead in blood indicated by this study.
From a comprehensive study in rabbits Moorman et al estimated a threshold for total sperm count of 23.7 μg/dl.9 Taking random variation and noise in an epidemiological study into account this is not entirely different from the 44 μg/dl found in this study. On the other hand, species differences in reproductive effects of lead are well known8 and the rabbit may be more susceptible to effects of lead than humans.
Despite a wide range in duration of exposure to lead in our study, we found no association between measures of long term exposure and semen characteristics. But perhaps lead does not accumulate in the tissue compartments of the testis which are of importance for spermatogenesis. The current concentration of lead in spermatozoa was not related to long term exposure when adjustment was made for current blood lead concentration (p=0.47).
The lowest effect level of about 45 μg/dl of lead in blood should be considered an average group threshold which does not necessarily apply to all individual workers. It is likely that some workers are more susceptible to the actions of lead and such subgroups are not detected by our analyses. For instance, the individual susceptibility to reproductive toxicity might be influenced by the genetic polymorphism of ALAD that modifies the toxicokinetics of lead.34 The deterioration of sperm chromatin structure found in the high range of sperm lead concentrations but not in the high blood lead groups may also indicate increased vulnerability of subsets of men. Besides the statistical uncertainties, it should be acknowledged that the threshold of 45 μg/dl found in this study is based on a group average, which is unlikely to protect all workers from the reproductive toxicity of lead. More research is needed to clarify whether subgroups of men are more vulnerable to the disruptive effects of lead.
In conclusion, this study indicates that adverse effects on sperm production and sperm chromatin structure are unlikely below a blood lead concentration of 45 μg/dl, but this concentration may not protect all workers. The results provide some evidence that total sperm count, sperm concentration, and chromatin structure are adversely affected above the threshold but the numbers of highly exposed subjects was small and chance findings are not entirely unlikely. Long term exposure up to more than 500 μg/dl.years was not associated with reduced semen quantity or quality.
Acknowledgments
The project was supported by grants from the European Commission (The Asclepios Project), the International Lead Zinc Research Organization (ILZRO), the United Kingdom Health and Safety Executive and the Fund of Scientific Research (Brussels). We are grateful to the 10 companies involved in the United Kingdom, Belgium, and Italy, plant managers, foremen, union deputies, occupational physicians, laboratory research assistants, secretaries, and the 503 participants who made this study possible. Professor Gorm Danscher is acknowledged for all his efforts in creating and sustaining the Asclepios research network from which this study emerged. We are indebted to Giorgio Leter and Eugenia Cordelli who did the SCSA analyses at the ENEA Casaccia Flow Cytometry facility in Rome; and to Dr Craig J Boreiko (ILZRO) for stimulating and constructive criticisms of an earlier version of the manuscript.