Article Text

Abstract
OBJECTIVES To facilitate decisions about interventions and to establish baseline values for future evaluation of preventive efforts, the aim of the present study was to elucidate the disease pattern among male professional drivers in Denmark. The study differentiated between drivers of goods vehicles and drivers of passenger transport.
METHODS Cohorts of all 20–59 year old Danish male professional drivers in the years 1981, 1986, 1991, and 1994 were formed, to calculate age standardised hospital admission ratios (SHRs) and time trends (1981–97) for many diagnostic aggregations.
RESULTS SHRs for diseases in practically all systems and organs of the body were higher among professional drivers than they were in the male working population at large. Also drivers of passenger transport, compared with drivers of goods vehicles, had significantly high SHRs due to infectious and parasitic diseases, diseases of the circulatory system, and diseases of the respiratory system, and significantly lower rates of injury. For both driver groups, the SHRs for acute myocardial infarction increased with time whereas the SHR for acute gastritis decreased, and for drivers of passenger transport an increasing SHR for chronic obstructive pulmonary disease, was found over time.
CONCLUSION Drivers of passenger transport and drivers of goods vehicles differ in their disease patterns. The results support the hypothesis that preventive efforts are needed in both groups, but underline that different strategies are required for different categories of drivers.
- professional drivers
- hospital admissions
- surveillance system
Statistics from Altmetric.com
Professional driving is associated with long hours in a single body posture, under exposure to vibration, vehicle exhaust, and noise. Furthermore, the work is performed in an environment that demands constant vigilance. During the past 50 years, the health of professional drivers has attracted a lot of attention, and many empirical studies of mortality and morbidity in this group have been performed. When all causes of mortality are regarded collectively the group seems to be doing well. Significantly lower standardised mortality ratios (SMRs) than those for all men in the same region as the standard population, have been reported for taxi drivers in Rome 1965–88 (SMR 0.89, 95% confidence interval (95% CI) 0.82 to 0.96),1 and for bus drivers in Copenhagen 1978–85 (SMR 0.73, 95% CI 0.60 to 0.88).2 With all economically active men in the same region as the standard population, the SMR among bus drivers in Sweden 1971–85 was 1.0 (95% CI 0.9 to 1.0),3and with unskilled workers as the standard population, an SMR of 1.00 (95% CI 0.89 to 1.11) was found among Danish lorry drivers during 1970–80.4 There are, however, many specific diseases for which significantly increased risks of mortality and morbidity have been reported. In a retrospective cohort study of incident cancers among Danish bus and tram drivers during 1943–92 increased risks were reported for cancer in the lung, larynx, pharynx, bladder, kidney, skin, rectum, and liver.5 Among lorry drivers an increased mortality has been found for multiple myeloma,4 colon cancer, laryngeal cancer, lung cancer, diabetes, non-alcohol related cirrhosis, and motor vehicle accidents.6 Professional driving has also been associated with a high relative risk for ischaemic heart disease (IHD),6 7 stroke,8prolapsed lumbar disc,9 prolapsed cervical disc,10 pain in neck and back,11 12gastrointestinal disorders,13 14 and chronic obstructive pulmonary disease (COPD).15 In San Francisco it was shown that hypertension increases with years employed as a transit vehicle operator,16 and from Denmark, it was reported that standardised hospital admission ratios (SHRs) among drivers of vehicles carrying passengers increased significantly in the period 1981–93 both for IHD and COPD.15 17 Among bus drivers it has also been reported that the rates of sickness absence were increased.18 19
To facilitate decisions about interventions and to establish baseline values for future evaluation of preventive efforts, the aim of the present study was to elucidate the disease pattern among male professional drivers in Denmark. The study would differentiate between drivers of goods and passenger transport. Because the drivers of goods vehicles are not in contact with passengers and the drivers carrying passengers are not handling goods we hypothesised that the two groups would differ in their disease patterns. More clearly, the people handling passengers would be more prone to communicable diseases, whereas the drivers of goods vehicles might be more prone to diseases related to the handling of goods—such as back problems. The added emotional demands associated with passenger handling by contrast with the added physical demands associated with handling goods might also produce different patterns of stress related diseases.
Materials and methods
DATABASE
Since the middle of the 1980s a series of cohort studies have been performed at the Danish National Institute of Occupational Health on hospital admissions among economically active people in Denmark. The information base for these studies is the occupational hospital admissions register, which is a research register with data at an individual level on occupations, hospital admissions, and dates of migrations and deaths. All men and women in Denmark aged 20–59 in January 1981, 1986, 1991, and 1994 are included and classified according to their most important occupation at the time. The information has been recorded by linkage of the population census of Denmark to the national inpatient register, the death register, and the employment classification module. The employment classification module contains yearly information on economic activity, and a classification of occupation and industry. The occupational code is an extended classification of the international standard classification of occupations (ISCO) 1968 version, which also includes self employed people. The industrial code is a national extension of the international standard classification of all economic activity (ISIC) 1968 version. The national inpatient register provides information on more than 99% of all admissions to Danish hospitals and it is updated every year. The personal identification number (PIN) from the national inpatient register was used in the cross linking procedure and for information on sex, date, and year of birth.
For various purposes these cohorts have been followed up for hospital admissions for various diseases. The outcomes have been first admissions with the studied disease as principal discharge diagnosis. Each time a specific study has been performed a table with people at risk, person-years at risk, and the number of hospital admissions by occupation, sex, and 5 year age group has been saved and stored in a database. Currently the database holds information from 75 follow up studies for hospital admissions in 36 different diagnostic groups. An overview of the diagnoses and follow up periods is given in table 1.
Diagnoses and follow up periods of studies of hospital admissions that have been performed at the National Institute of Occupational Health, Denmark
VALIDITY OF THE BASIC INFORMATION
Age and sex are parts of the PIN and are recorded almost without errors. The completeness and accuracy of these data are shown by the fact that the matching of various registers on the PIN was 100% complete. Misclassifications in the employment classification module are negligible among the public sector employees who total about one third of the male and half of the female workforce. In the private sector the primary data producers do not routinely check data on occupation, but information from various sources is compared and pooled together in the employment classification module. A recent thesis showed that 66% of the bus drivers employed in greater Copenhagen for more than 6 months in 1980, according to company personnel files, were also classified as employed by a bus company and as a bus driver in the classification of occupations. An additional 30% had one piece of the information correct. It was shown that such misclassifications tend to bias occupational risk ratios slightly towards unity.20
COHORT SIZES
The total numbers of male taxi and bus drivers in January 1981, 1986, 1991, and 1994 were 6371, 8105, 7337, and 7002 respectively. The corresponding numbers in the group “other male drivers” were 64 774, 58 934, 52 859, and 50 716.
STATISTICAL ANALYSES
Standardised hospital admission ratios, in the latest available period, were calculated for all of the diagnoses given in table 1. The SHR was obtained by dividing the observed number of hospital admissions by the expected number and then multiplying this ratio by 100. The expected number was based on the corresponding age specific hospital admission rates for all gainfully employed men in Denmark. Age standardised risk ratios between the groups “taxi and bus drivers” and “other drivers” were also calculated.
As seen in table 1, data on some of the diagnostic groups have been collected for several disconnected periods. It was therefore possible to evaluate time trends for the SHRs for these diseases. Hence, we calculated mean annual rates of change for SHRs for the diseases IHD, acute myocardial infarction, cerebrovascular disease, varicose veins of lower limbs, COPD, chronic bronchitis, asthma, gastric ulcer, duodenal ulcer, gastritis, arthrosis of the hip, prolapsed cervical disc, and prolapsed lumbar disc. As hospital admissions are rare compared with the number of people at risk an appropriate way to model time trends of SHRs is by a log linear Poisson regression with the expected number of discharges as an offset.17 For time we used the distance in years between the midpoints of the follow up periods in each of the cohorts. We estimated the parameters with SAS Proc Genmod (SAS Institute) and we calculated the large sample 95% confidence intervals (95% CIs) with the estimated standard errors.
Results
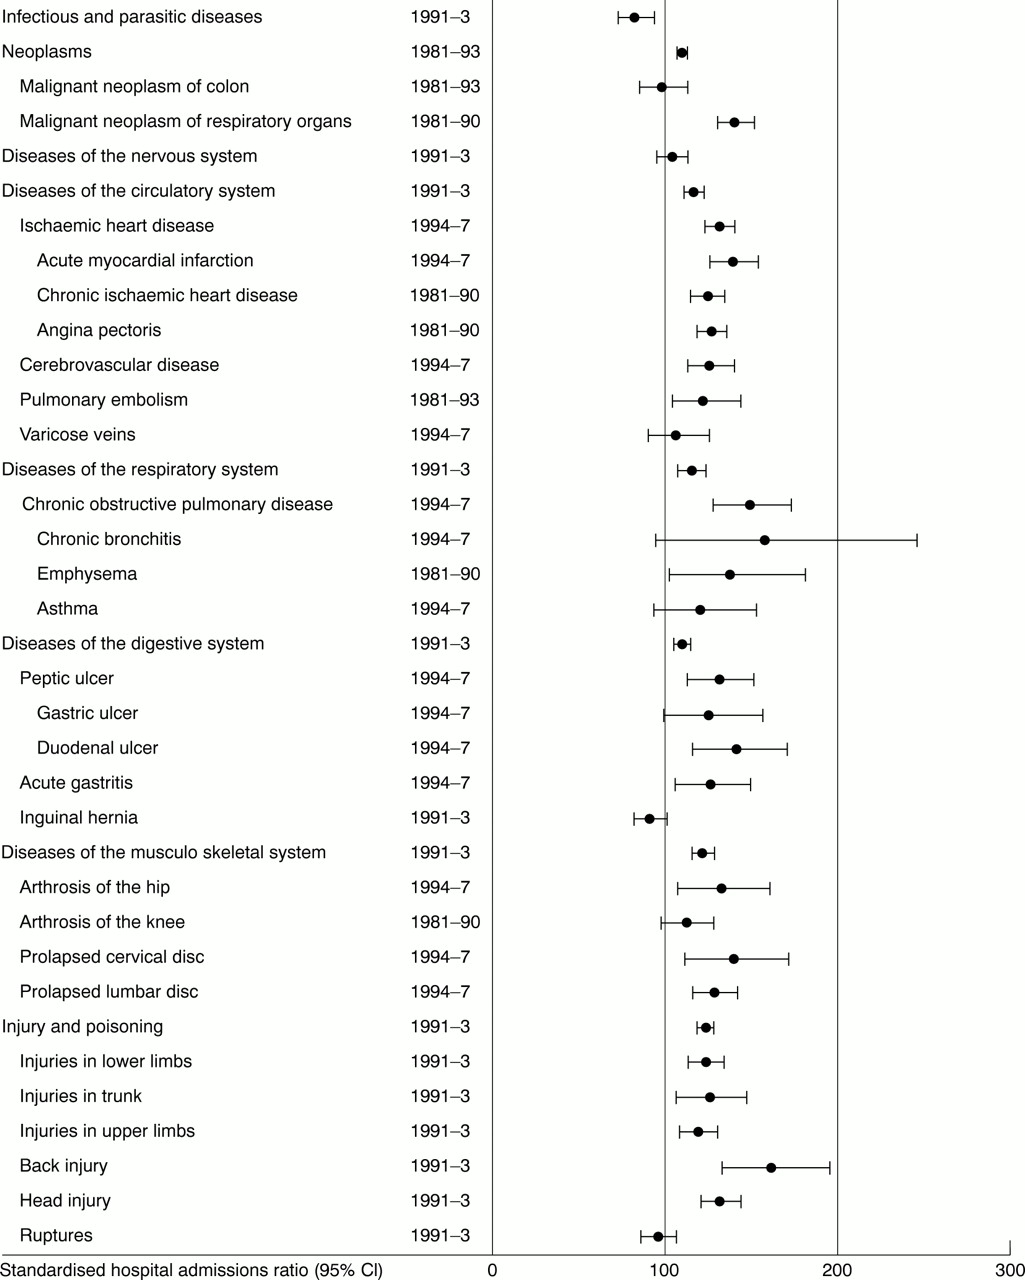
Significantly increased SHRs for the disease categories neoplasms, diseases of the circulatory system, diseases of the respiratory system, diseases of the digestive system, and diseases of the musculoskeletal system were found both for the drivers with passengers (fig 1) and the drivers of goods vehicles (fig 2). The SHR for infectious and parasitic diseases was significantly high among drivers of passengers, and significantly low among drivers of goods vehicles. The reverse situation was found for injury and poisoning. None of the driver groups differed significantly for hospital admissions due to diseases of the nervous system and sense organs. The estimated risks of infectious and parasitic diseases, diseases of the circulatory system, and diseases of the respiratory system were significantly higher among drivers of passengers than drivers of goods vehicles, whereas the estimated risk for injuries was significantly lower (table 2).

Age standardised SHR (95% CI), for various diagnoses, among male taxi and bus drivers in Denmark.

Age standardised SHR (95% CI), for various diagnoses, among male drivers of goods vehicles in Denmark.
Age standardised risk ratios of hospital admission among male drivers of passengers compared with male drivers of goods in Denmark
As seen in table 3, the SHR for acute myocardial infarction in both driver groups increased significantly with time, whereas the SHR for acute gastritis decreased. Among drivers of passengers the SHR for COPD also increased significantly. Table 4 suggests that the increasing trend in acute myocardial infarction among drivers of passengers might have come to an end. No such sign is, however, apparent for the SHR among the other drivers (table 5).
Average annual rate of change (95% CI) of age standardised hospital admission ratios (SHR) among male drivers in Denmark
Age standardised hospital admission ratios (SHR) (95% CI) among male taxi and bus drivers in Denmark
Age standardised hospital admission ratios (SHR) (95% CI) among male drivers of goods in Denmark
Discussion
We found that age standardised SHRs for diseases in practically all systems and organs of the body were higher among professional drivers than they were in the male working population at large. Another finding was that drivers of passenger transport, compared with drivers of goods vehicles, had significantly high SHRs due to infectious and parasitic diseases, diseases of the circulatory system and diseases of the respiratory system, and significantly lower rates due to injuries. We also found that, for both driver groups, the SHRs for acute myocardial infarction had increased with time whereas the SHR for acute gastritis had decreased, and for drivers of passenger transport we found an increasing SHR for COPD over time.
We used hospital admissions as a proxy measure for the underlying morbidity. Studies of this type are often associated with referral bias arising from social and geographical differences in the tendency to consult hospitals for medical care.21 All health care in Denmark is, however, free of charge and emergency hospitals are geographically distributed in a way that hospital care can be promptly reached by any citizen. It was shown that for IHD referral was subject to bias in only hospital staff.21 We expect the same to be true also for other diseases. Another classic confounder is the “secondary healthy worker” effect.22 To reduce this effect all economically active people were used as a standard in the present study, and all estimates were based on follow up of a fixed population for at least 3 years.
Several exposures that may cause IHD have been identified in the working environment of bus and lorry drivers. The list includes lack of vigorous exercise,23 excess smoking, unhealthy eating habits, and being sedentary in leisure time,24 25neurophysiological strain,26 night and shift work,27 air pollution especially small particles,28 stressors including work barriers, defined as obstacles that cause extra work or unsafe behaviour; time pressure; monotonous conditions; and time binding, defined as control over timing,29 conflicting demands, and other job stresses.30 Professional driving may also be associated with distress from self perceived effort-reward imbalance,31 32 defined as a notion of inadequate payment, lack of esteem and approval combined with high efforts.33 Another risk factor would be harmful distress from a combination of low decision latitude and high demands,34 which has been shown to be associated with a wide variety of diseases.12 35 Leviet al may therefore be right when they proposed that the health problems among drivers could be explained by a multiple exposure model including physical, ergonomic, and organisational stressors.36 It is also known that socioeconomic factors—such as education, lifestyle, and personal economy—are inversely correlated with health.37 Although employers might see it as their task to alleviate the health burdens which can be related to specific occupational exposures, the global health issue in this profession calls for concerted action which includes employer, employees, and occupational health authorities as outlined in the Luxembourg declaration, 1997, by the European Network for Workplace Health Promotion.38 In the present study we did not have information based on individual data on education, lifestyle, or personal economy. It is therefore not possible to tell from the available data if the higher morbidity of professional drivers is due to physical and ergonomic workplace conditions, psychosocial workplace conditions, lifestyle choices, general effects of social status, or a combination of these factors.
On the basis of the previous studies mentioned in the introduction to this paper, we would expect to find increased SHRs for malignant neoplasms of respiratory organs, IHD, stroke, prolapsed lumbar disk, prolapsed cervical disk, and COPD in both of the driver categories examined. We would also expect the hospital admission profiles not to disagree too much with an overall mortality among taxi and bus drivers, which is equal to or slightly lower than that among other economically active men, and a mortality among lorry drivers that is roughly equal to that of other unskilled workers. The present study found high SHRs for all of the diseases already mentioned (fig 1-2). As most deaths among people of economically active age are due to external causes,39 the low risk of injury and poisoning among drivers of passengers (fig 1), might be an explanation as to why the mortality studies mentioned in the introduction did not find an increased all cause mortality among bus and taxi drivers.1-3 However, as the proportion of externally caused deaths decreases with age, and IHD followed by neoplasms are the most common causes of death among older men,39 the disease pattern suggests that the expectation of remaining life among older drivers of passengers would be low, not only compared with all actively employed people in the same age group but also compared with other unskilled workers.
We know that smoking is a significant risk factor both for IHD40 41 and COPD.42 We also know that the prevalence of smokers in Denmark has decreased considerably during the past decades: in 1970, 1987, and 1997 prevalences were 68%, 50%,43 and 38% (V Borg, National Institute of Occupational Health, Denmark, personal communication, 2000). According to the same surveys, the prevalences for male unskilled workers in the same years were 75%, 64%, and 45%, respectively. The prevalence of smokers among professional drivers in Denmark was 73% in 1972,44 and 64% in 1997 (V Borg, National Institute of Occupational Health, Denmark, personal communication, 2000). Hence, the SHRs for the diseases related to smoking, IHD and COPD, were expected to increase during the period spanned by the present study. However, even if the increase in the SHRs for these diseases were fully explained by a slower rate of stopping smoking among drivers compared with other economically active men, this need not be regarded purely as a confounder. What and whom you work with influence lifestyle. In a study of two classic risk factors—body mass index (BMI) and smoking—among professional drivers in Sweden, it was concluded that both of these factors are related to work. Occupational stress was one of the best predictors for intensity of smoking whereas long work hours behind the wheel was a predictor for high BMI.45 It has also been concluded that smoking habits are related to social norms at the workplace.46-48
Air pollution, in the form of dust and fumes, is another risk factor for airway diseases.15 It has been shown that professional drivers in an urban compared with a non-urban environment, are exposed to higher concentrations of ambient air pollution.49 As most of the taxis and buses are in the cities, the average concentration of air pollution among drivers of these would be higher than among the drivers of goods vehicles. Hence, the different rates of hospital admission for respiratory diseases in the two groups might be due to differences in exposure to air pollution. Added stressors in the form of demands and job stress from passengers might be an explanation for the higher IHD risk among the drivers of passengers compared with drivers of goods vehicles.26 50 Exposure to passengers would also be an explanation for the increased risk of infectious and parasitic diseases among the taxi and bus drivers, whereas the handling of goods might explain the increased risk of injury among the other drivers. When explaining the different disease pattern in drivers of passengers and drivers of goods vehicles, one should consider the possibility that drivers might cross over from one type of work to the other—for example, drivers of goods vehicles becoming passenger drivers after being unable to perform heavy physical work. In a study of cancer among Danish bus drivers that is not yet published it is shown that 129 out of 766 bus drivers had also been employed as lorry drivers (H Soll-Johanning, National Institute of Occupational Health, Denmark, personal communication, 2000). From this viewpoint the differences between the two groups might have been underestimated in the present study. It is, for example, not impossible that some of the hospital admissions for musculoskeletal disorders among the passenger drivers might be due to late effects of injuries inflicted upon them during previous work as drivers of goods vehicles.
According to research in ergonomics, people who spend time sitting and then perform demanding lifting shortly afterwards, may be at increased risk of hyperflexion injury to the disc and ligaments, and prudent advice to those who experience prolonged full flexion postures (more than 20 minutes) would be to stand and walk for a few minutes before performing demanding manual exertions.51 From this viewpoint it is obvious that a sudden shift from a sedentary position during driving to manual handling of heavy goods would be a risk factor for back injuries. To prevent back injuries among drivers of goods vehicles, it is therefore necessary that the employers either provide them with appropriate auxiliary lifting devices or give them the extra time needed to recover from the sitting, before lifting, pushing, or pulling heavy loads. It is also important that the rules and recommendations on lifting, as laid out by the labour inspectorate, are known and followed by the driver.
The increased SHRs for IHD, COPD, and malignant neoplasm of the respiratory organs, together with the data on high prevalences of smokers among professional drivers, give sufficient information to recommend that campaigns on stopping smoking should be tailored to these groups. In such campaigns it might be wise to also combat any factor from the working environment that may act to impede the process of stopping smoking—such as job strain.
Improved air conditioning, and a physical screen between driver and passengers are examples of possible measures that might be taken to reduce the risk for airborne diseases among passenger drivers. The present study does not provide sufficient information about the causes and mechanisms that underlie the increased risk of infectious diseases and further research is clearly needed before any such recommendations are made. It is, for instance, not known how many drivers can and actually do wash their hands after dealing with money, and before they eat their homemade Danish open sandwiches.
Such specific measures should, however, only be a detail in much broader health promotion programmes which should focus on the work organisation, education and training, physical (ergonomic) matters inside and outside the bus or lorry, and aspects of lifestyle. A recent evaluation of 13 natural experiments to reduce stress in bus drivers favours inclusion of stress prevention measures in such programmes.52
In conclusion, the results support the hypothesis that preventive efforts are needed, and underline that slightly different strategies are required for different categories of professional drivers.
Acknowledgments
The present study was supported by the Danish Health Insurance Fund, grant No 11/108–99.
References
ANSWERS (for questions see p 287)
(1)(a) True
(b) False
(c) False
(d) True
(e) False
(2)(a) False
(b) False
(c) True
(d) False
(e) True
(3)(a) True
(b) False
(c) True
(d) True
(e) False
(4)(a) True
(b) False
(c) True
(d) False
(e) False
(5)(a) True
(b) True
(c) True
(d) True
(e) False