Article Text

Abstract
OBJECTIVES To investigate loss of colour vision related to exposure to solvents and the role of three enzyme polymorphisms in modifying the risk in exposed workers.
METHODS A sample was studied of 68 male dockyard workers and 42 male community controls with and without neuropsychological symptoms from a previous cross sectional study. Indices of cumulative and intensity based exposure to solvents were calculated for all subjects. Alcohol, drug, and smoking histories were obtained. Colour vision was tested by Lanthony D15d colour vision test. Genotype of glutathione S-transferase M1 and T1 and N-acetyltransferase 2 polymorphisms were determined.
RESULTS The relation between impairment of colour vision and exposure to solvents was investigated with multiple regression techniques. Increasing annual exposure to solvents was significantly associated with reduced colour vision (p=0.029). Impairment of colour vision was not associated with neuropsychological symptoms as measured by the Q16 solvent symptom questionnaire. No significant association was found between acquired impairment of colour vision and genetic polymorphisms when GSTM1, GSTT1 or NAT2 phenotypes were included in the analyses.
CONCLUSIONS Exposure to mixed solvents is associated with impairment in colour vision, the risk increases with increasing exposure. The risk of impairment of colour vision was not altered in this study by the presence of different GSTM1, GSTT1 or NAT2 polymorphisms.
- colour vision
- organic solvents
- genetic polymorphisms
Statistics from Altmetric.com
Organic solvents are used in a wide variety of industries ranging from paint manufacture to engineering, and over 1 million workers are regularly exposed in Britain. Although well recognised in Scandinavian countries,1 there is a lack of awareness of the chronic health effects of solvents in the United Kingdom. Neurological effects covering a broad range from chronic toxic encephalopathy2 3 to impaired colour vision4 5 have been linked to solvent use. Some,4-8 but not all,9-12 studies of workers exposed to solvents have identified an excess of deficits in colour vision. Most acquired loss of colour vision is subclinical although some people do report altered blue-yellow perception. Acquired deficits usually affect blue-yellow but may progress to affect red-green vision.13 There is increasing interest in testing colour vision as a means of detecting subclinical solvent induced neurological damage in workers exposed to solvent.14
Some studies of colour vision in exposed workers have assessed workplace exposure to solvents with current occupational hygiene measurements at the present work site.7 This technique fails to take account of cumulative lifetime exposure. To ensure that health effects, should they exist, are not masked by misclassification of exposure there is a need for more detailed assessment of lifetime exposures.
Neurotoxic effects may be influenced by genetic factors, as many enzymes that metabolise organic solvents show polymorphisms that may act as risk modifiers.15 There is considerable interest in the glutathione S-transferase multigene family.16 17Glutathione S-transferase M1 (GSTM1*0) and glutathione S-transferase T1 (GSTT1*0) play an important part in phase II metabolism. People with the null genotype of one or both of these enzymes may, on exposure to solvents, be unable to detoxify solvent metabolites as quickly as may those with the positive genotype. Glutathione S-transferase M1 has been shown to act as a risk modifier for solvent neurotoxicity.15 Its substrates include styrene 7,8 oxide,18 a metabolite of styrene, a solvent used in repair of fibreglass boats. Glutathione S-transferase T1 metabolises dichloromethane, a widely used paint stripper.19 Studies in the United Kingdom have shown the population prevalence of the null genotype of GSTM1 to be 45%,16 that of the null genotype of GSTT1 to be 18.5%,17 and that of the slow acetylator status of N-acetyltransferase 2 (NAT2) to be 58%.20
We aimed to investigate the relation between exposure to solvents and colour vision and to examine if either glutathione S-transferase or N-acetyltransferase 2 polymorphisms influence the risk of developing defects in colour vision.
Methods
SUBJECTS
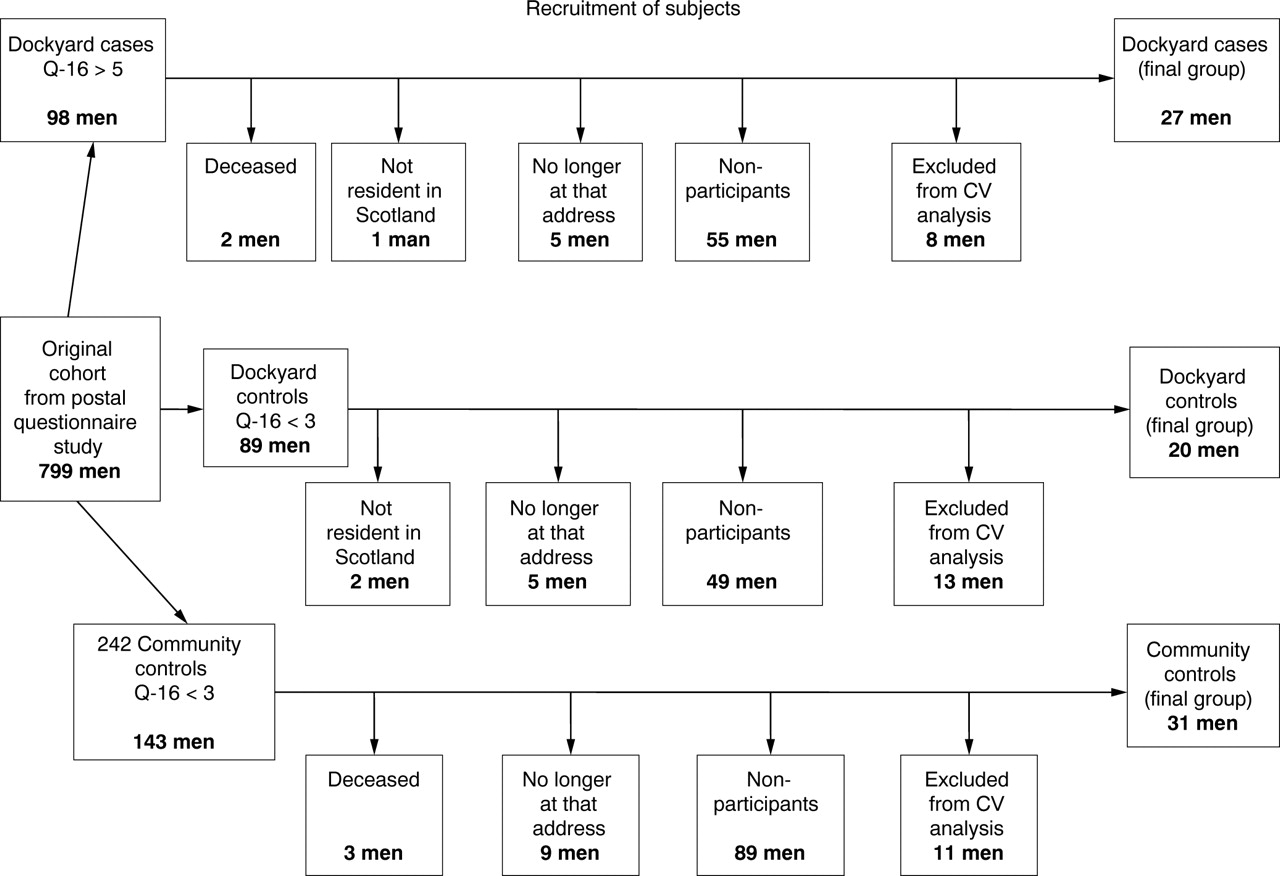
We contacted 330 subjects who had previously participated in a cross sectional study of dockyard painters and of randomly sampled community controls.21 One hundred and ten men agreed to take part in this second phase of our work. The subjects were selected from the original cohort on the basis of their responses to the Orebro Q-16 questionnaire, to include people who had many of the 16 possible neuropsychological symptoms and those who had few or none. The questionnaire has been described in an earlier report.21Subjects were selected (figure) for this colour vision study if they gave less than three positive responses on the Q16 (n=75) or if they provided more than five positive responses to the Q16 (n=35). For the purposes of this analysis, subjects were classified by their exposure to solvents rather than by neuropsychological symptoms. The study group consisted of three subpopulations of exposure to solvents. The community controls (n=42) had primarily worked in occupational environments with zero or low exposure to solvents. The dockyard painter group (n=68) was divided into two groups: the skilled painters (n=31) who had completed a 5 year apprenticeship and the painter labourers (n=37). The skilled painters were, in general, involved in painting cabins, companionways and ships messes. By contrast the painter labourers worked in engine rooms, machinery spaces, and especially in tanks. These tanks ranged in size from large multistorey spaces to tiny, highly confined environments, and were used to store ballast, drinking water, fuel, or waste materials. They were initially shot blasted down to bare metal then brush painted. Duration of service was markedly different in the two painter groups; most craft painters spent most of their working lives in the painting industry whereas painter labourers generally had short painting careers before moving on to other jobs.

Recruitment of subjects.
All participants gave informed consent, the local research ethics committee having approved the protocol. For the colour vision analyses, exclusion criteria included low visual acuity (worse than 6/30), known nervous system disease, diabetes mellitus, recent exposure to solvents (within 16 hours), and self reported congenital colour vision deficits.
EXPOSURE
Personal levels of exposure to solvents were assessed with a structured approach. Work history information from all 110 subjects was gathered from a self completed questionnaire. This was followed by detailed occupational interviews to collect data on working practices, processes, and control measures, and a further 13 interviews with experts who were able to provide data on working conditions relevant to jobs they managed or supervised. Data on solvent concentrations were obtained from a literature review and several records available of paint types and monitoring data collected in the 1980s. Three dockyard tours allowed us to understand the process and current working conditions.
Employment history since leaving school was evaluated at interview. Each change in employer or job title was recorded along with a brief job description and start and end dates. Information on tasks carried out within each job was obtained and, with a list of solvent related tasks, more specific data on certain jobs was collected. This provided data both on the materials used and factors that have been shown to influence personal levels of exposure—such as ventilation and room size. Jobs were then classified for exposure to solvents. This created a list of 25 job codes that were used to describe the type of the employment and the job title. A database detailing the job code classification per quarter year for each of the 110 subjects' working lives was then generated.
The process of estimating personal exposures in each job code took account of changes over time in work practices and methods. It was possible to identify the time when important changes in processes and material formulation were introduced, so the 25 job codes were subdivided into 89 job code eras (each job code generated between one and nine eras). In turn, each was further divided into primary job tasks and 127 job tasks were produced (each job code era had between one and eight tasks; there was often considerable overlap between job tasks throughout the eras). With reports from expert interviews, an estimated time fraction of the working day was allocated to each of the primary job tasks which made up a job code era.
The assessment of exposure to solvents used the subjective modelling strategy of Cherrie and Schneider.22 This simple multiplicative model used assigned values for three variables that measure personal exposures; the natural ability of the substance to enter the airborne environment (termed the intrinsic emission), the method of handling, and the effect of localised control measures. Guidance values for these variables were drawn up for each of the paint types, application methods, and ventilation systems used in the dockyard. The assessment was then modified with factors for general ventilation and respiratory protective equipment.
Before undertaking assessments of exposure to solvents the estimator (SS) was trained in the use of the model. This involved assessing levels of exposure from various descriptions of job tasks. The degree of correlation and accuracy between the estimated exposures and the measured results was calculated. The final training exercise produced a correlation coefficient of 0.89 between the log transformed estimate and measured values with on average a slight (1.08) overestimate of the log of the measured value.
Six solvents or mixtures were identified as the primary solvents used and were used as markers for other solvents that had similar chemical and biochemical properties. These were xylene, methyl ethyl ketone, white spirit, 2 ethoxy ethanol, dichloromethane, and acetone. Personal levels of exposure were then assessed with the subjective exposure model for each of 762 task-solvent combinations. For quality assurance, 5% of all estimates were repeated and confirmed to be within ±25% of the original. The task-solvent estimates were then summed according to the time fraction spent on the task, and a time weighted average (TWA) exposure to solvents for each of the six solvents was generated for the 89 job code eras.
The job code era exposures were then applied to the work history database and the lifetime exposure to solvents calculated, first for each of the solvents and then as total exposure to solvents where each solvent fraction was measured relative to the occupational exposure limit (OEL).23 The sum of these fractions was used as a lifetime total solvent index and expressed as cumulative total solvent in OEL-years. An OEL-year was defined as exposure at the occupational exposure limit for that solvent for 8 hours a day for 240 working days a year.
As well as the cumulative exposure index, a measure of intensity of exposure to solvents was generated. This was the cumulative total solvent divided by the number of years of employment exposed to solvents. This mean annual intensity is expressed in OEL units.
ASSESSMENT OF COLOUR VISION
Colour vision was measured with the Lanthony D15d colour arrangement test.24 This test involves matching a series of colour chips, laid out at random, against a reference chip in colour order. It has been shown to be sensitive to acquired colour vision deficits.14 The test was administered in a standardised manner, each eye being tested individually, glasses being worn if needed. The light source was a 1250 lux McBeth Sol-Source daylight lamp. Visual acuity was measured with a Keeler half size chart at 3 m. The results of colour vision testing were entered onto a personal computer and the colour confusion indices25 were calculated with the software package Mathcad 4.0. A score of 1 in each eye is indicative of perfect colour perception. Right and left eye scores were added and the result divided by 2 to produce the colour confusion index. A perfect score in both eyes was thus expressed as 1, with higher colour confusion indices representing deficits in colour vision.
ENZYME POLYMORPHISMS
Genotyping was carried out by multiplex polymerase chain reaction (PCR) analysis of the GST polymorphisms. This modified PCR method used primers to amplify GSTM1 and GSTT1 genes in the same PCR reaction mix.26 27 As determination of the null genotype is based on the presence or absence of a PCR product, a positive control was coamplified in the same reaction. The NAT2 gene was amplified by PCR and the product then subjected to restriction enzyme digestion which allowed identification of the most common NAT2 alleles found in white people.28 The results of the NAT2 genotyping analysis were then phenotyped as fast acetylators or slow acetylators.
STATISTICAL ANALYSIS
Statistical analyses were carried out with SPSS version 8. To find the relation between colour vision and exposure to solvents, multiple regression analysis was performed on the 78 participating subjects, with the total colour confusion index as the dependent variable and age, alcohol, and exposure to solvents (cumulative exposure or average annual intensity) as the independent variables.
The relation between the total colour confusion index and average annual intensity index was investigated with multiple regression on the 78 participants. Age and alcohol were included in the model as these have previously been shown to be associated with the colour confusion index.14 29 Natural logarithims of the colour confusion index were taken to ensure that the assumption of constant variance was fulfilled. A Pearson correlation matrix was constructed to investigate the relation between variables and also to check for multicolinearity between variables. The other assumptions of multiple regression—that is, normal distribution of residuals and adequate fit—were checked and found to be adequate.
Multiple regression analysis was also used to investigate the relation between the logged colour confusion index and each of the three gene types—GSTM1, GSTT1 and NAT2—in turn, controlling for age, alcohol, and the average annual intensity index. For GSTM1 and GSTT1, people were classified as zero if they were null genotype for that gene and one if they were the positive genotype. For NAT2, people were classified as zero if they had the slow acetylator phenotype and one if they had the fast acetylator phenotype (including fast/fast genotype and fast/slow genotype). Correlation coefficients between age, alcohol intake, and both the cumulative exposure and average annual intensity index were calculated. There was no significant association between these variables.
Results
From the 110 subjects, 78 met the inclusion criteria, the others were excluded mainly because of low visual acuity or congenital colour vision defects. Table 1 compares details relating to age, alcohol intake, years of education, cumulative exposure score, mean annual solvent intensity, and distribution of the three genetic polymorphisms for the total group (n=110) with the subjects eligible for study (n=78). There was no significant difference in the distribution of any of these variables between the final group of 78 subjects and the initial 110. The distribution of genetic polymorphisms is similar to that reported in previous studies,16 17 20 and is thus evidence that our selection process did not introduce bias of enzyme genotype.
Comparison of whole study group with those eligible for inclusion
This study was nested within a previously reported postal study of painters and community controls.21 The mean (SD) ages in the postal study were 52 (14) years for painter cases, 48 (13) years for painter controls, and 51 (14) years for community controls. The mean (SD) ages in this study were 54 (13) years for symptomatic painters, 52 (11) years for asymptomatic painters, and 56 (14) years for community controls. The proportion of current smokers among all painters in the postal study was 37% compared with 35% of current smokers in this study. The proportion of current smokers among community controls was 25% in the postal study and 24% in this study. The proportion of teetotal painters was 16% among the postal study and 15% in this study and for community controls 13% and 12%, respectively.
ASSOCIATION BETWEEN EXPOSURE AND COLOUR VISION
The repeat estimates of personal levels of exposure assessed with the subjective exposure method were all within ±25%. With two measures of exposure, cumulative exposure and mean annual intensity of exposure to solvents, we analysed the relation between working with solvents and colour vision scores. Colour confusion index was significantly associated with age (r=0.385, p<0.001) and mean annual exposure to solvents (r=0.225, p<0.05). A significant association between colour confusion index and cumulative exposure (r=0.264, p<0.02) was also found. Not surprisingly, a significant association between cumulative exposure and age was also found; there was, however, no association between mean annual exposure and age, and therefore mean exposure was used in all subsequent analyses. The results of the multiple regression analysis are presented in table 2 and show that after adjustment for age and alcohol intake, the coefficient for mean annual intensity is significant (p=0.029).
Multiple regression analysis for colour confusion index
To exclude the possibility of selection bias influencing the association between colour vision and exposure to solvents, we investigated any association between symptom scores as assessed by Q-16 questionnaire and acquired loss of colour vision. We compared those who had multiple neuropsychological symptoms with those who had few symptoms. Those with less than three positive symptoms from the Q16 questionnaire had a mean (SD) colour confusion index of 1.35 (0.27) whereas those with six or more symptoms had a mean (SD) colour confusion index of 1.34 (0.25). Thus selection of subjects with high and low symptom scores is unlikely to have introduced a bias.
EFFECTS OF GENETIC POLYMORPHISMS
When multiple regression analysis was used to investigate the relation between the logged colour confusion index and each of the three genotypes—GSTM1, GSTT1 and NAT2—in turn, controlling for age, alcohol, and the average annual intensity index, no significant relations were found (p=0.98, 0.7, and 0.85, respectively). Analysis of the genotypes of people by employment associated with high (>OEL) exposures showed there to be only one GST null-null genotype among 28 in the ever category, compared with eight of 50 in the never group. This difference was not significant (p=0.1) by Fisher's exact test.
Discussion
Some previous studies4-8 have shown that workers exposed to solvents are at risk of developing deficits in colour vision. These studies have generally assessed currently exposed workers who may be experiencing short term and reversible effects. Our study aimed to measure colour vision performance and relate this to lifetime exposure to solvents. We excluded people who had worked with solvents in the 16 hours before testing to reduce the possibility of measuring an acute effect. The use of a mean intensity of exposure to solvents brought to light an effect that was not apparent when exposure was assessed simply in terms of current job (unpublished data) or even, as is shown here, with an index of cumulative exposure to solvents. This may explain why some studies10 11 have failed to show any effect of solvents on colour vision, and emphasises the importance of using relevant exposure indices when assessing the putative health effects of any occupational or environmental exposure. We think that our exposure assessment method is an improvement on simpler measures used in this field.
Our results show increasing mean annual exposure to solvents to be associated with increasing risk of having colour vision deficits, even when allowing for the confounding effects of age and alcohol consumption, both of which may independently affect colour vision. This suggests that deficits in colour vision are associated with exposure to solvents, and is evidence of a causative relation.
It is important to consider whether these results may have been influenced by selection of the subjects. They were originally selected, for a separate study, as contrasting groups with few or multiple neuropsychological symptoms. It is possible that those with high symptom scores also had high exposures and increased risk of deficits in colour vision, and this may have confounded our results. However, we found no association between colour confusion indices and their Q16 symptom status, making this an unlikely explanation of the findings.
Practical issues relating to the demands made on the volunteers made for a low response rate of 37%, and this study was also nested within a postal study that itself had an overall response rate of 57%.21 We have previously shown that the response rate of the postal study is unlikely to have led to bias.30 The painters who participated in the present study were slightly older than those in the postal study but had similar smoking and drinking habits. It should be noted that the postal study was carried out 3 years before this study. The mean age of the community controls in this study was 5 years higher than in the postal study, suggesting that younger community controls were underrepresented in the current study. A recent north American study of retired painters31 obtained a very similar response rate of 25%–31%. Such rates must lead to caution in generalising to the original population but do not invalidate conclusions for associations within the group studied; this would require the introduction of some confounding factor. The most likely such factors, age and alcohol consumption, together with a possible selection bias already mentioned, have been taken into account in our analyses.
Our analysis of the effect of GSTM1, GSTT1, and NAT2 polymorphisms on susceptibility to deficits in colour vision induced by solvents showed no significant difference. It is possible that we failed to show an association because of the relatively small study population. We calculated that our study had sufficient power to detect an increase in the null genotype of GSTM1 from 45% (the population prevalence in Scotland) to 80% in the subjects with impaired colour vision induced by solvents. Detection of smaller differences between the normal population and the cases would require much larger study groups. Inevitably when working with many possible factors such as genotype and exposure class, the number of subjects within each cell becomes reduced to levels where it is difficult to identify significant differences. Moreover, it is likely that combinations of different enzyme genotypes, acting at different points in the metabolism of chemicals, have a greater influence on toxicity than individual ones; investigation of such interactions would require very large study populations. To date we are only able to state that age and exposure to solvents are more important determinants of defects in colour vision than the genetic phenotypes studied. However, only one of the 28 people (3.6%) who had worked in an environment associated with high peak exposures (exposures greater than the OEL) had the GSTT1 null-null genotype compared with eight of the 50 people (16%) in the remaining population. This was not significant and may be a chance finding.
The association between deficits in colour vision and exposure to solvents, together with evidence of a chronic encephalopathy in workers exposed to solvents,3 31 suggests that there may be a role for testing colour vision to detect subclinical neuropsychological changes induced by solvents. Our study has not shown a relation between neuropsychological symptoms and impairment of colour vision, but we are currently investigating whether such deficits are linked to other measurements of neuropsychological impairment in workers exposed to solvents.
We conclude that mixed exposure to solvents at high concentrations impairs colour vision. Further work is required to determine what measure of exposure best identifies this increased risk and whether this impairment is an indicator of other neuropsychological impairment.
Acknowledgments
This study was funded by grants from the Health and Safety Executive (HSE) (Ref R51.168) and the British Occupational Health Research Foundation (BOHRF). FD was the recipient of a travelling scholarship from the William Ramsay Henderson Trust. We gratefully acknowledge the support of these bodies.