Article Text

Abstract
Objective To compare work injuries treated in an emergency department (ED) and injuries reported to the Danish Working Environment Authority (DWEA).
Methods Work injuries of the ED, Odense University Hospital, and injuries from the geographical catchment area reported to the DWEA between 2003 and 2010 were included. The injuries included in both datasets were identified by merging the ED file and the DWEA file using the civil registry number and injury date information as key.
Results Approximately 50 000 work injuries occurred in the catchment area of the ED. The intersection between the two injury registration systems was 16%. A major discordance concerned the type of injuries, as some injuries were seen frequently in the ED but not reported to the DWEA to any significant extent, for example ‘eye injuries’ and ‘superficial lacerations or wounds’. On the other hand, some injuries are rarely seen in the ED, but often reported to the DWEA, for example ‘low back pain’. Additionally, younger workers visit the ED more often than older workers, and injuries in the high risk sectors have the lowest reporting proportion.
Conclusions Neither the ED nor DWEA injury files alone give a complete picture of work injuries. But merged, they represent a significant number of injuries, taking into account differences in data sources, for example concerning uneven distribution of age, sex, type of injury and type of industry. Obviously, not all serious work related ED injuries resulting in lost work time are reported to the DWEA.
Statistics from Altmetric.com
In Denmark, employers are obliged to report work-related injuries to the Danish Working Environment Authority (DWEA) if the injury leads to sick leave lasting one or more days beyond the day of the injury. Further, some predefined work injuries of the self-employed, including farmers, are lawfully required to be reported. The Danish system is aimed at compensation claims, but the reporting system is also designed for surveillance of work injuries and this system is assigned to a special legislation under the board of the DWEA.1 Despite differences in coverage, the workers’ compensation systems and reporting legislation are quite similar across the EU. However, the European systems are not comparable to the reporting system in North America, which in general covers a varying proportion of employees and the self-employed. These differences between European and American reporting systems are relevant when selecting the ‘population at risk’ for estimating work injury incidences.1–,3
In many western countries, including Denmark, it has been recognised for many years that underreporting of work-related injuries is rather widespread and the number of officially reported work injuries only represents a minor part of all injuries.2 ,4–,9 The methods and sources used to calculate the level of underreporting vary across time periods and countries, and thus, the reporting rate is not fixed but varies from a few per cent to more than 80%. A recent Danish study, which merged data from the DWEA register of reported work injuries and 134 005 injuries treated at five emergency departments (EDs) between 1998 and 2006, showed that only 20% of the ED injuries were reported to the authorities.6 Fractures and amputations accounted for 9121 of the ED treatments, and among these injuries, 47% were reported to the DWEA. A similar, but smaller study from Norway, which has the same reporting system as Denmark, revealed a similar low reporting proportion of 13% for all injuries and 32% for serious injuries defined as ‘abbreviation injury scale score’ more than two.5 Both studies found a below average reporting proportion within agriculture and construction. A Dutch study found an underreporting of work injuries of around 35% by combining the government safety register with the statutory organisation register that insures employees against absence from work for medical reasons.4 Likewise, a number of recent US studies based on official data records, for example, from the US Bureau of Labor Statistics, have also documented that the national estimates for work related injuries significantly undercount the total number of injuries occurring, especially in high risk industries.2 ,7–10
None of these previous studies has analysed the overall impact of injury types or the mutual effect of sex, age, injury and industrial settings, on the chance of being reported to the authorities. Further, some studies indicate that some injury types are more likely to be reported to the authorities than others, and thus some injuries are primarily seen in different parts of the healthcare system, for example at EDs.5 ,6 ,11–,13
Injuries admitted to the ED for treatment is one major additional source of information regarding work injuries, which can be compared to reported injuries. At the ED at Odense University Hospital (OUH), a free 24-h emergency service, all work injuries have been recorded for years. Each injury record contains a wide range of information concerning health and work. Merging these ED data of work injuries on the individual level with the work injuries reported to the DWEA from the same geographical area provides opportunities to study differences in injury patterns between the two registers, and thus provides better possibilities for assessing the character of the constantly ongoing discussions of underreporting. To our knowledge, such an approach has not previously been published, except for a one small US study and a recent Canadian study.3 ,11
The first aim of the current study was to compare the injury patterns between injuries treated in an ED and injuries reported to the DWEA. The second aim was to assess variations in proportions of reported and non-reported injuries in relation to sex, age, injury type and industrial setting.
Methods
The population base for the study comes from worksites situated in the six municipalities located around OUH, which is situated in the city of Odense on the island of Funen in central Denmark. These municipalities are the primary catchment area of the open ED at OUH and are a well defined mixed rural and urban geographical area. The number of inhabitants (362 000) represents approximately 6.7% of the Danish population. The area is demographically and industrially comparable to the general Danish society according to Statistics Denmark. Work injuries treated in the ED and injuries reported to the DWEA from this geographical area between the years 2003 and 2010 were included in the study.
All inhabitants in Denmark are provided a unique 10-digit personal civil registry number (CRN), which follows each individual for his/her entire life.14 All injury records from the ED and DWEA register contain the CRN of the injured person and the injury date, which were the individual key variables used for merging the two datasets, as well as merging and adding the individual industrial setting affiliation from the Integrated Database for Labor Market Research, Statistics Denmark (IDA).15
The ED at OUH treats around 37 000 patients annually. Since 1980 all injured individuals seeking treatment at the ED of OUH have been asked specifically: ‘Did this injury occur while doing paid work? Yes/No’. Only those answering ‘Yes’ are included in the project. Further information related to job and circumstances leading to the accident were simultaneously obtained as well. All injury-related information was coded, standardised according to the ‘Nordic Classification of External Causes to Injuries’ (NCECI), and subsequently validated by another staff member who reviewed all written information describing the case and also the coding used for parameters in the current study. In case of complete lack of causal factor information, patients were contacted by mail. The patients are diagnosed according to the ICD10 code system. Data validation has been performed continuously since the formation of the register.12 ,16 ,17 From 2003–2010, a total of 33 030 work-related injuries were registered in the ED, representing 26 129 persons with one or more visits in the period. Individual information on industry ties was obtained by merging with IDA. The 6-digit national industry code was transformed into five broad sectors, ranging from low risk sectors such as public services and administrative work, a medium risk sector (eg, industrial manufacturing), and a high risk sector (eg, construction, agriculture and transport).18 The industry codes were missing in less than 1% of the records, which were manually coded by the first author based on the information of the company name in the ED injury file. In Denmark, every enterprise is assigned a unique code and an associated 6-digit industrial code in the Central Business Register (CVR). This information is freely available.19 Those ED records without the name of the enterprise were assigned to one of the five broad industrial codes based on additional information in the record, for example job task information.
The injury register of the DWEA provided individual data for all injuries reported from 2003–2010, covering Denmark and Greenland, a total of 320 000 notifications. The DWEA keeps an electronic register of all work-related injuries in Denmark going back to 1993, which includes individual information on personal background, injury, industry ties and municipality of the company. This information has been validated by experienced staff members of DWEA before data are entered into the database.1 The number of DWEA reported injuries in the ED catchment area was 24 603, representing 20 598 people with one or more reports. The 6-digit industry code was transformed to the same five sectors which were used for the ED data.18
The injuries included in both datasets were identified by merging the ED file and the DWEA file. However, the injury date information might not always be correct, as some injured persons might not seek emergency room treatment immediately, but instead some days after the injury, and in other cases employers might by mistake have reported an incorrect (but close to the correct) injury date. To counter this, the date match was broadened to include 6 days before and after the reported injury date. Further, the type of injury had to be identical in both registries, otherwise the case was considered as a new event. A total of 45 records were excluded due to invalid CRN, or multiple records of the same injury.
Descriptive analyses of proportions and the χ2 test were conducted to compare injury patterns across the two registers. We used multivariable logistic regression analysis to evaluate the relationship between non-reported and reported injuries (reference), with age, sex, and type of injury as independent variables. Due to opposite distributions of the combination of age, sex, industrial setting, and ED/DWEA data it was not possible to obtain an overall multivariable logistic regression model, in particular due to the very low number of women in the construction and industrial manufacturing industries. The analysis was therefore done separately for each of the five industrial settings. Thus, the OR (with 95% CI) risk estimates are reported separately for each of the five different industrial setting in all analyses. Selected interaction within each setting was evaluated but none were found to affect the predictive power of the final models. In the model, the OR for each variable was adjusted for the two other variables, respectively; for example, sex was adjusted for age and type of injury. All analyses were performed in STATA V.12.
Results
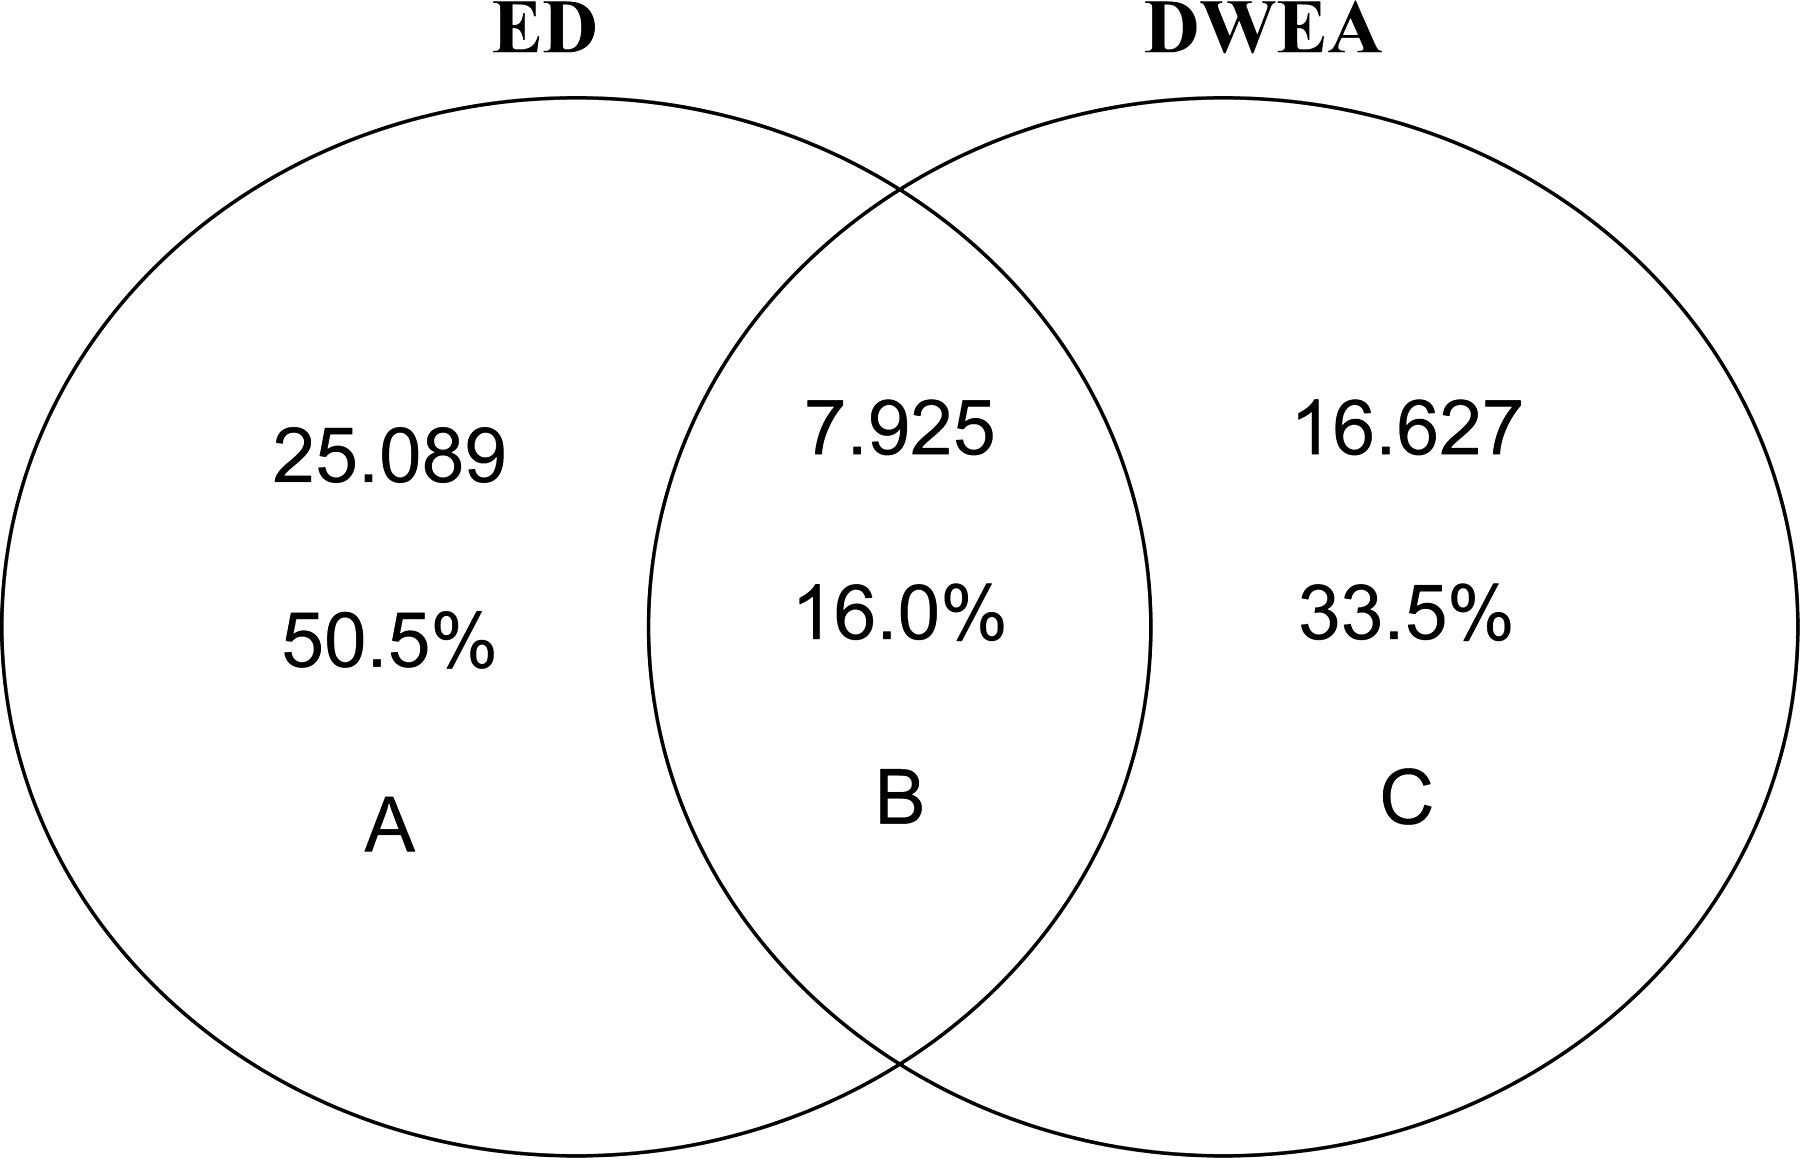
Figure 1 shows two circles which represent the number of injuries recorded at the ED and the number of injuries reported to the DWEA. The intersection (area B) is the number of injuries present in both injury registration systems and included approximately 8000 events (16%). The total number of recorded injuries between 2003 and 2010 was approximately 50 000 (area A+B+C). The ED register contained 33 014 injury events (area A+B) and the DWEA register contained 24 552 injury events (area B+C).

The number of injuries from the emergency department (ED) geographical catchment area that are either seen at the emergency room (ED) (area A+B) or reported (area C+B) to the Danish Work Environment Authorities (DWEA). The intersection (area B) is the injuries which are both seen in the emergency room and reported to the DWEA.
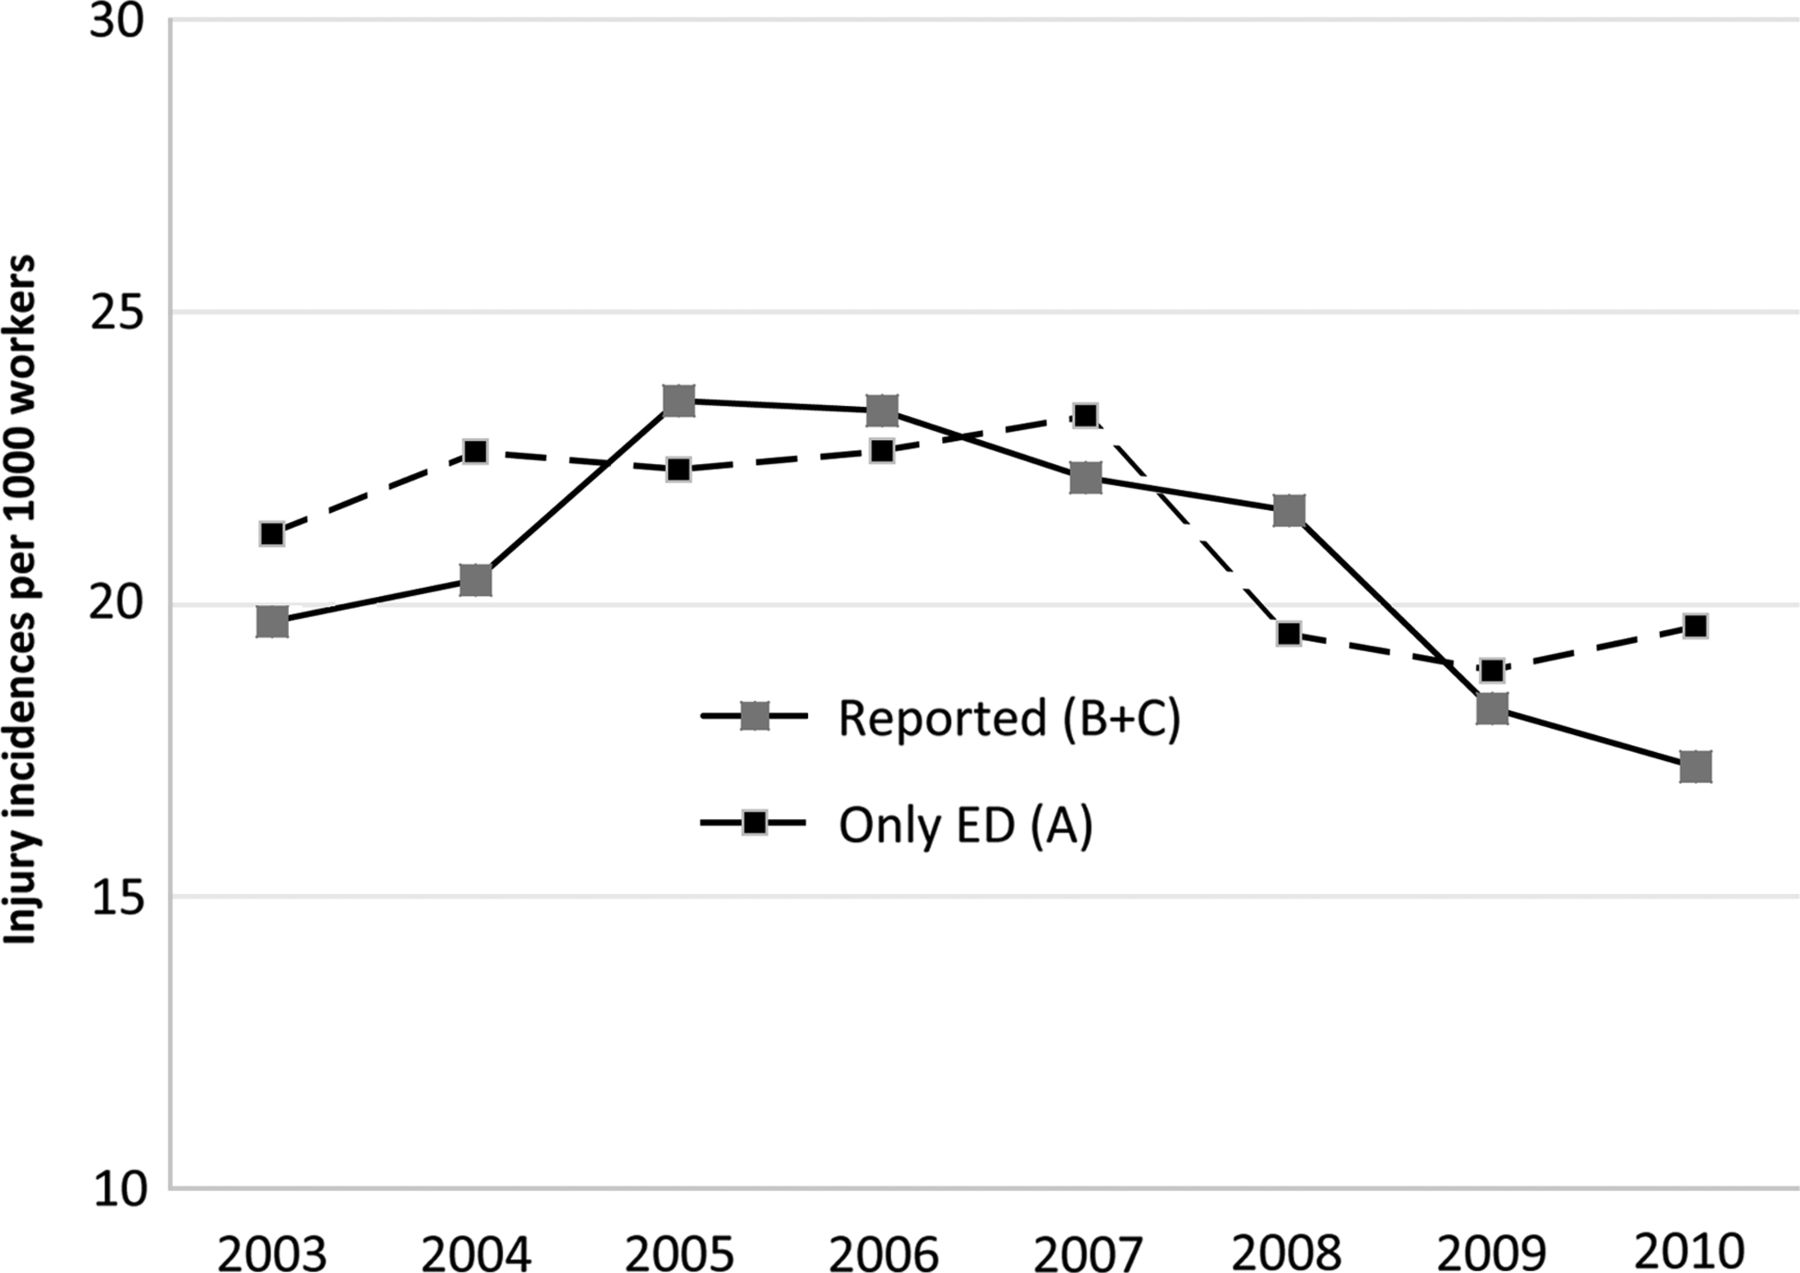
Figure 2 shows the annual injury incidences at the ED only (area A), and work injuries treated in the ED and/or reported to the DWEA (area B+C) from 2003–2010. Visually, the curves are very similar in level and shape year by year during the 8 years of observation. The mean incidence for both injury systems is around 20 injuries per 1000 employed workers—a little lower during the first, and more noticeable during the last years of observation.
Table 1 shows the number of injuries in all industries combined, and in five industrial settings stratified into sex and age groups according to ED injuries only (A), and in ED and/or reported injuries (B+C). In general, significantly more women than men, as well as significantly fewer young workers than older workers have been reported with injuries to the DWEA. Within all types of industrial settings, significant differences in sex and age distribution are also seen, except for ‘miscellaneous and undefined industrial sectors’, which has the same sex distribution between reported and non-reported injuries. Also, across the industrial settings, sex and age are unevenly distributed, with many injured men in ‘construction, agriculture, transport sectors’ and ‘industrial manufacturing’, whereas the opposite picture is seen in the ‘health and social services sectors’.
The number of injuries in the industrial settings stratified into sex and age according to ED injuries only (A), and in ED and/or reported injuries (B+C)
Table 2 shows the most frequent body part–nature of injury combinations distributed in the same two subgroups as in table 1, sorted by decreasing proportional order of reported injury (last column), and separated into three sub-groups representing a high, medium or low reporting proportion. Low back pain, probably accounting for around 5000 incidents, together with different sorts of arm sprain, are among the most frequently reported injuries. Very few of these cases have been treated in the ED. The low reporting injuries represent different types of ‘superficial lacerations or wounds’, ‘superficial cauterisation or burns’, ‘eye injuries’ and ‘foreign body in the eyes’. These types of injury are predominately treated in the ED. The injuries listed in the middle of the table are in general equally seen in either the ED or reported to the DWEA. The predominating injuries are different sorts of ‘amputations or fractures’, ‘sprains in legs’ and ‘different sorts of cauterisation or burns’. Some of these injuries are probably serious and must have caused days away from work, depending on workload and type of job.
The most frequent body part–nature of injury combinations of all injuries, emergency department (ED) injuries only (A), and ED and/or reported injuries (B+C), sorted by decreasing proportional order of reported injury (last column) and separated in three sub-groups representing a high, medium or low reporting proportion
Table 3 shows the adjusted OR (ORadj) of ED only injuries (A) compared to all reported injuries (C+B), stratified in five industrial settings. Significant sex difference are only seen in the ‘health and social services sectors’, with men appearing four times more frequently in the ED than women, whereas no sex differences are seen in the other industrial settings adjusted for age and type of injury. Compared to the older workers, young people in general have a higher risk of having their injuries treated in the ED without being reported to the DWEA. An exception from this pattern is seen in the combined group of ‘miscellaneous settings’, where the chance of being reported and treated in the ED is independent of age. But these injuries only represent a minor part of all injuries. Further, the chance of injuries being reported to the DWEA or treated in the ED is not the same for the different types of injuries. The most striking result is the predominance of the injury types ‘wounds, cauterisation or burns’ that occurs 2–13 times more often in the ED than in the DWEA across all industries with ‘sprain’ used as reference. But the other type of injuries, adjusted for age and sex, also occur with a higher risk of seeking ED treatment than would be expected based on the proportion of reported injuries, including ‘amputation or fractures’.
Logistic regression and adjusted OR in solely ED injuries (A) compared to all reported injuries (C+B), stratified into five industrial settings (OR for sex adjusted for age and type of injury etc, N=number of injuries)

The annual incidences of work injuries treated at the emergency department (ED) only (area A), and work injuries treated in ED and/or reported to the Danish Work Environment Authorities (area B+C).
Discussion
During 8 years of observation, approximately 50 000 work injuries have occurred in a broad and well developed industrialised region populated by 362 000 individuals. This figure probably does not cover all work injuries, as some may have been self treated or treated in primary medical care.12 ,13 But there is no doubt that the numbers represent a significant part of the work injuries occurring in the catchment area of the ED at OUH. Thus, apparently neither ED nor the DWEA injuries alone represent a complete picture of work injuries. It is remarkable that the intersection between the two injury registration systems is so small, only 16%, which indicates that the two systems contain different and independent injury information. In a similar study from a well defined US county, the intersection between ED and reported injury cases was even smaller at around 9%.11 The Canadian study also compares the sources of ED and reported injuries, but analyse the two systems as independent of each other.11
From 2003 to 2010 the annual incidence trends for both ED and DWEA injuries have a very similar shape, with the highest injury incidences observed in the mid observation period around 2005–2007. In most western countries the general injury incidence trend has been decreasing over the last decades.3 ,20 However, studies have shown that the trends of work injuries are not linear but vary in a cyclic manner, which especially seems to be associated with the economic business cycle, that is, during booms an increase in injuries is observed and vice versa during recession.20 ,21 ,22 The precise nature of this relationship is unknown, but seems related to changes in workplace safety and/or changes in reporting behaviour.21 During booms there is, for instance, a higher work pace, less time for training and longer working hours, which are well known risk factors of injury. Reporting behaviour might change due to fear of dismissal and could lead to a lower level of reporting during recessions. In our study we found the highest injury incidences during a time period characterised by high economic activity, which worldwide was abruptly transformed into a recession in 2008 followed by a decrease in injury incidences in both systems. The very close relationship between ED and DWEA annual injury incidences during all 8 years of observation does not support the idea that the business cycle has a strong impact on reporting behaviour, assuming that seeking ED treatment for injuries is independent of macro-economic relationships. Although our results are preliminary, it indicates that the level of underreporting of injuries has been a relatively constant phenomenon during the observation period.
A major discordant in data content between the two injury registration systems concerns type of injuries, including the bodily location of the injuries. Apparently, some injuries are seen frequently in the ED but not reported to the DWEA to any significant extent, for example ‘eye injuries’, ‘superficial cauterisation or burns’ and ‘superficial lacerations or wounds’. This is as would be expected as these types of injury often do not lead to sick leave beyond the day of injury and thus are not required to be reported to the DWEA. On the other hand, some injuries are seldom seen in the ED but often reported to DWEA, for example joint sprains and low back pain. A majority of these reported joint sprain injuries are probably non-traumatic musculoskeletal injuries. In Denmark, treatment of such injuries is primarily sought at general practitioners, not the ED. Our results are in accordance with those of Mustard et al.3 Indeed, these overall specific register affiliated injuries include a very majority of all injuries in both systems, combined. Intuitively, the most serious injuries probably appear in the highest proportion in the medium reporting sub-group; surprisingly, even for injuries such as ‘amputations and fractures’, 35–40% were admitted to the ED without being reported to the DWEA. Further, it is not obvious why soft tissue injuries, which include injuries to tendons, muscles, eyes and inner organs, are not treated more often in the ED, but are apparently serious enough to be reported in large numbers to the DWEA. Almost the same pattern was observed in the US study, and diagnoses such as contusion, foreign substances and laceration were more likely to be seen in the ED and apparently treated without loss of work time.11 Diagnoses such as strain/sprain, especially low back pain, dislocation and fractures, which often led to lost work time, were also in this study the most frequently reported injuries. These results underline that neither the officially reported work injury nor the ED data alone give a complete or accurate picture of work injuries, but in many ways are complementary to each other. But it is also clear that such a large minority of potentially reportable ED injuries indicates that underreporting of injuries is still a significant problem. Thus, the overlap between the two injury sources ought to be somewhat bigger than the 16% observed.
Additionally, we found discordances in the distribution pattern of sex and age across the industrial setting in the two sources of work injuries. Male and younger workers visit the ED more often than female and older workers. The opposite tendency is seen for DWEA injuries. But, in a multiple regression analysis with reported cases as reference, young workers have a higher risk of seeking ED treatment than would be expected based on the incidence of reported injuries adjusted for sex and type of injury, and the higher risk remains across all industrial sectors. In the study of Fingar et al,11 the age and sex distribution pattern of ED visits was more or less the same as in our study. But the study found no clear picture concerning age distribution among workers reporting an injury. The study of Mustard et al3 also found a higher proportion of young workers who visit the ED more than would be expected based on the incidence of reported injuries. This tendency exists for both sexes, which is contrary to our results where the impact of sex disappears in the multivariate model, except for those working in the ‘health and social service sectors’. Men in this sector have a higher risk of ED visits than women, but the reason for that is not clear. We see several reasons for the observed inverse age pattern in reporting behaviour, which is partly supported by Mustard et al.3 First, young workers seems to be more likely than older workers to seek treatment in the ED.3 The reason for that specific age-related health behaviour is unknown. Second, they are not as established in the labour market as older workers and fear of dismissal might make them hesitant to report injuries to their supervisor, who is responsible for reporting the injury to the authorities. In contrast, young workers can rely on the ED, which in Denmark is free and open for confidential treatment with no economic consequences for either workers or companies. Third, the injuries might not cause the same consequences for young and older persons, and young workers might be more willing to return to work without sick leave. The study of Mustard et al3 supports this last hypothesis, which intuitively will tend towards lower reporting for young people. But in our study, we have adjusted for different types of injury and indirectly for seriousness, and still the age-specific difference remains across industries. Thus, in general, the two first mentioned reasons are probably also important.
In our study, injuries in the construction, transportation and agricultural sector have the lowest reporting proportion, whereas injuries in ‘the public health and social services sectors’ have the highest proportion. The low reporting proportion in high injury risk sectors such as construction and agriculture is well known.5 ,10 ,23–,25 A US study analysing data covering 15 years from five major national data sources showed that the construction industry had the greatest underreporting, especially among the smaller companies.7 Underreporting may also partly be traced to a suboptimal safety climate in companies.26
The study has at least four strengths. First, the DWEA data have for many years been used to track changes and progress in national health and safety intervention efforts as well as local public health objectives. These efforts might be improved by adding data from the ED, as injuries, for example from well known underreported industrial settings, are well represented in the ED register. Obviously, including ED data might compensate for the missing injuries in the DWEA register, and thus provide better knowledge for initiating safety measures. Second, due to the unique Danish 10-digit personal CRN, which links every single person in Denmark to a workplace, we were able to determine the real number of work injuries by merging the two registration systems within a defined geographical region in Denmark. Worldwide individual-level record linkage at that level of completeness is only possible in a few countries, among them the Nordic countries. Further, additional population based information within defined geographical boundaries, such as total employment and employment in sub-sectors, as well as individual information in the database of Statistic Denmark, is available, for example socioeconomic data and educational skills. Third, our samples are representative of the general working population in Denmark with regard to age and sex distribution as well as the proportions of industrial and occupational groups. Fourth, both sources of administrative injury data have been validated, and validation is still a routine, ongoing administrative process.1 ,16
The main limitation of our study is the lack of information on days away from work in the ED database, which is important information for assessing the real proportion of underreporting of work injuries.
Conclusion
Based on the ED and DWEA datasets, we conclude that neither dataset alone gives a complete or accurate picture of work injuries. But merged, the two registers provide a more complete representation of work injuries, taking into account differences in data in the two systems, for example concerning uneven distribution of age, sex, type of injury and type of industry. Combined, it might provide adequate knowledge important for specific preventive initiatives against work injuries. It is important to underline that the ED dataset is limited in its ability to detect underreporting in the official reporting system, because not all work related injuries result in lost work time. But it is obvious that not all serious work related ED injuries resulting in lost work time are actually reported to the DWEA.
What this paper adds
-
Work injuries reported to the authorities are used to monitor progress in work site health.
-
However, it is well known that these data are biased due to significant underreporting and do not represent all work injuries.
-
A more complete and accurate picture of work injury patterns can be obtained by adding emergency room injury data, which significantly differs from reported injuries concerning injury type, industrial setting, age and sex.
-
Combining these data sources provide more adequate knowledge, which is important for specific preventive initiatives.
References
Footnotes
-
Contributors FL and JML prepared the study plan, contributed to the analysis plan, conducted the analyses, wrote the first version and prepared the final version of the manuscript. KR and KJN prepared the study plan, and contributed to analyses and to inputs to the manuscript.
-
Funding The Danish Confederation of Trade Unions (LO).
-
Competing interests None.
-
Provenance and peer review Not commissioned; externally peer reviewed.