Article Text

Abstract
Aims: To predict the expected number of pleural mesothelioma deaths in the Netherlands from 2000 to 2028 and to study the effect of main uncertainties in the modelling technique.
Methods: Through an age-period-cohort modelling technique, age specific mortality rates and cohort relative risks by year of birth were calculated from the mortality of pleural mesothelioma in 1969–98. Numbers of death for both sexes were predicted for 2000 to 2028, taking into account the most likely demographic development. In a sensitivity analysis the relative deviation of the future death toll and peak death number were studied under different birth cohort risk assumptions.
Results: The age-cohort model on mortality 1969–98 among men showed the highest age specific death rates in the oldest age group (79 per 100 000 person-years in the age group 80–84 years) and the highest relative risks for the birth cohorts of 1938–42 and 1943–47. Among men a small period effect was observed. The age-cohort model was considered the best model for predicting future mortality. The most plausible scenario predicts an increase in pleural mesothelioma mortality up to 490 cases per year in men, with a total death toll close to 12 400 cases during 2000–28. However, using different assumptions this death toll could rise to nearly 15 000 in men (20% increase). Mortality among women remains low, with a total death toll of about 800 cases. It is predicted that the total death toll in the period 2000–28 is 44% lower than previous predictions using mortality data from 1969 to 1993.
Conclusion: Adding five recent years of observed mortality in an age-cohort model resulted in a 44% lower prediction of the future death toll of pleural mesothelioma. A statistically significant period effect was observed, possibly influenced by initial asbestos safety guidelines in the 1970s and introduction of the ICD-10 codification.
- epidemiology
- mesothelioma
- age-period-cohort model
- prediction
Statistics from Altmetric.com
In 1960 Wagner et al reported the first conclusive association between asbestos exposure and pleural mesothelioma.1,2 Mesothelioma affects mainly older men who in their youth were exposed to asbestos in the workplace. Its incidence in industrialised countries is about 5–50/million/year (male to female ratio between 5:1 and 11:1). The average latency period between first exposure to asbestos and diagnosis is 30 to 40 years, but shorter as well as longer latency periods have been observed; the longest latency periods were reported among women with possible household exposure.2–4 Since the 1960s, mesothelioma has gained interest worldwide as a result of its increasing incidence, its ominous prognosis, and medicolegal issues.5
During the 1990s, forecastings of mesothelioma mortality in several developed countries were made based on mortality data before 1995.6–11 They estimated a rise in fatal cases until 2010–20, after which a fast decline is expected because of asbestos bans. These projections used generalised linear models to calculate future deaths and to explain separate effects of age, year of birth (that is, cohort effect), and/or year of death (that is, period effect). For the Netherlands an increase from 300 pleural mesothelioma deaths in 1995 to approximately 960 around 2025 was predicted, with a fast decline after 2030.6 A similar projection for Western European countries for the period 1995–2029 suggested an increase in the Netherlands to around 950 cases in the period 2020–25.9 Since results of these analyses are sensitive to small changes in age specific mortality and birth cohort risks, it was expected that the inclusion of most recent mortality data may change previous predictions. The first preventive measures on asbestos use in the Netherlands were introduced in the mid-1970s.12,13 Hence, it is of interest to evaluate whether the inclusion of data from 1994 to 1998 has a perceivable influence on the pleural mesothelioma mortality.
The objective of this paper is to predict the expected number of deaths from 2000 to 2028 and to conduct a sensitivity analysis in order to study the influence of changes in model assumptions on the prediction.
METHODS
Subjects
Statistics Netherlands (CBS) provided the latest mortality figures of pleural cancer and mesothelioma between 1969 and 1998, yearly age distributions of the Dutch population from 1949 to 1998, and estimations of Dutch population growth from 2000 to 2030. Standard extrapolation demographic techniques were applied for the latter figures. The Netherlands Cancer Registry provided the morbidity figures of pleural mesothelioma between 1989 and 1997. Pleural cancer was defined using the International Classification of Diseases and Related Health Problems (ICD). For the period 1969–78, ICD-8 163.0 pleural cancer was used, for 1979–95, ICD-9 163 pleural cancer, and from 1996 onwards, pleural mesothelioma as ICD-10 C450. We assumed cases of pleural cancer to be pleural mesothelioma on a ratio 1:1 for the time span 1979–95. In some countries it has been shown that a substantial porportion of deaths coded 163 are not pleural mesothelioma and a correction factor was applied for predictions in Western Europe.7,9,14 However, because in the Dutch Cancer Registry 80–90% of all diagnoses were histologically confirmed, and the total numbers in the Cancer Registry and the Mortality Registry did correspond very well, it is assumed that overestimation of pleural mesothelioma cases by using the pleural cancer numbers will be very small.15 In the Netherlands, the non-mesothelioma pleural cancers in the Cancer Registry over the period 1989–98 were less than 10% of all pleural cancers.15 From 1996 to 1998, because of changes in the coding system at the Mortality Registry, the majority of mesothelioma deaths were registered as C459 (unspecified mesothelioma). We estimated the number of pleural mesothelioma deaths from 1996 to 1998 by the total number of mesothelioma deaths (C45) minus the estimated number of non-pleural mesothelioma deaths. The estimated number of non-pleural mesothelioma cases was derived from available information from the Netherlands Cancer Registry over the period 1989–1997 (18.5 for men, 20 for women).15
In the analysis, deaths in people younger than 25 or older than 85 years were not considered because they are very rare, and imprecision in the diagnosis among the elderly has been reported.16 Male and female mortality were separated, because of the occupational nature of the disease and the historically very low participation of women in the industrial workforce in the Netherlands.12
Statistical analysis
All analyses were performed using Generalised Interactive Linear Models (GLIM), version 4.09.17 Data were tabulated into 12 five-year age groups (25–29 to 80–84 years old), 6 five-year periods (1969–73 to 1994–98), and 15 five-year birth cohort groups (1885 to 1955), identified by mid-point year (that is, the birth cohort 1945 comprised those born from 1943 to 1947). Since mortality from pleural mesothelioma under the age of 40 years was very rare, the 1953–57 birth cohort was the youngest cohort for which an risk estimate could be obtained. In order to calculate the number of person-years at risk, interpolation was used to estimate the relative contribution of adjacent birth cohorts to the death rate in a particular year and age group.
We calculated age specific mortality rates per 100 000 person-years and relative risks by birth cohort and period. We used an age-period-cohort modelling technique, with the assumption that the number of cases follows a Poisson distribution, being the logarithm of death rates an additive function of the parameters.18–21 The birth cohort of 1943–47 was assigned the value 1. Fitting was done using an intercept only model, a one-factor (age, period, or cohort) model, a two-factor model (age-cohort, age-period, or cohort-period), and a three-factor model. This last model used period as a continuous variable or two periods with cut off 1996. Individual parameters and their confidence intervals were estimated by the maximum likelihood method (scaled deviances). Changes in scaled deviances between models were evaluated by the Pearson’s χ2 test and p values were calculated. In order to predict the expected number of pleural mesothelioma deaths in the period 2000 to 2028, the age specific rates per birth cohort were multiplied by the projected age specific survival in the Dutch population up to 2028.
Sensitivity analysis
In the sensitivity analysis four models were evaluated with differences in available data on mortality from pleural mesothelioma, statistical modelling, and assigned birth cohort risks (see table 1). Model 1 was an age-cohort model derived from available mortality data 1969–93. It included the assumption that the risks of birth cohorts after 1958 sharply decline with assigned risk of 0.44, 0.20, and 0 to the birth cohorts 1958–62, 1963–67, and 1968–72, respectively. This “old” model has been published previously.6 Model 1 compares well to previous predictions on pleural mesothelioma mortality in Europe which have also been based on available mortality data 1969–93.9,10 Models 2 to 4 all used available mortality data 1969–98, thus, including an additional five years of observed mortality from pleural mesothelioma. Model 2 was an age-cohort model, but without any assumption on changes in cohort specific risks of men born after 1957. Hence, men born after 1957 were assigned a similar risk as birth cohort 1953–57. Model 3 was also an age-cohort model with the assumption that the risk of birth cohort 1958–62 was 50% of the risk of the previous birth cohort. Birth cohorts beyond 1962 were assumed to have zero risk. This hypothesis was based on the dramatic decrease in asbestos use. In the Netherlands asbestos use after 1984 was very small and an asbestos ban was implemented in 1993.6,13 This “prior knowledge” was used in the most plausible assumption on future mortality prediction. Model 4 was an age-period-cohort model, introducing a period effect to model 3, reflecting the introduction of ICD-10 in 1996.
Four models with differences in available data on mortality from pleural mesothelioma, statistical modelling, and assigned birth cohort risks to be used in predictions of number of deaths from pleural mesothelioma 2000–28
The sensitivity in predictions was evaluated for peak numbers of deaths and total death toll. Model 3, regarded as the most plausible model, was used as reference against all other models. In addition, this model was chosen to present details on age specific mortality rates and birth cohort risks.
RESULTS
During 1969–98, 5526 people in the Netherlands died as a result of pleural mesothelioma (ratio male to female 6.5:1). The mortality in men increased from 65 cases in 1969 to 265 cases in 1998. The death rate rose from 1.0 per 100 000 in 1969 to 3.9 per 100 000 in 1993, remaining more or less stable since then. For women, the number of cases showed an irregular pattern, reaching a peak of 43 deaths in 1994 and a subsequent sharp decline to 19 cases in 1998. The death rate among women fell from 0.4 per 100 000 in 1969 to 0.25 per 100 000 in 1998. The highest number of cases in men occurred in the age group 65–69 years (800 cases) and for women in the age group 70–74 years (125 cases).
Figures 1 and 2 describe the incidence of deaths from pleural mesothelioma among men and women by age group and five-year period. The mortality rates among persons of 45 years or younger are not depicted since these were close to zero. In each period the incidence of deaths from pleural mesothelioma increased strongly with age. Among men the 50–54 year age specific rate was 14 per 100 000 person-years and the 70–74 year age specific rate was 143 per 100 000 person-years. Among women these rates were 0.8 and 5 per 100 000 person-years, respectively. There was an increase over time in the age specific mortality rates for both men and women in the age groups above 60 years, most notably for the eldest age groups. On the other hand, among men and women younger than 60 years the age specific mortality rates were fairly constant during the period 1969–98.

Incidences (per 100 000 person-years) of deaths from pleural mesothelioma among men, 1969–98, according to age group and five-year period.

Incidences (per 100 000 person-years) of deaths from pleural mesothelioma among women, 1969–98, according to age group and five-year period.
Table 2 evaluates the goodness of fit of different models for men and women. Among men, age, cohort, and period all were significant, but the introduction of age (change in deviance 8109; degrees of freedom (df) = 11) and cohort (change in deviance 5000; df = 13) increased the fit considerably more than period (change in deviance 627; df = 5). Two-factor models fitted the data better than one-factor models and the age-cohort model showed the best fit with least differences between observed and fitted number of deaths. The introduction of a period effect in the age-cohort model was statistically significant, especially for a period effect distinguishing 1996 onwards from 1995 backwards (change in deviance 24, df = 1) Nonetheless, the overall results in terms of deviances and degrees of freedom were very similar when comparing the age-cohort model and the age-period-cohort model. Among women similar results were found, although a cohort-period model had a better fit than an age-cohort model.
Evaluation of goodness of fit (change in scaled deviance) of an age-period-cohort modelling technique for number of deaths from pleural mesothelioma, 1969–98
Table 3 presents the age specific mortality rates and the relative risks for birth cohorts in model 3 for both men and women. There was an exponential increase in the age specific rates among men and women, reaching its peak in the age group 80–84 years in both sexes. There was a steady increase in the relative risk for the birth cohort 1888–92, reaching its maximum for the birth cohort 1938–42 (relative risk 1.03, 95% CI 0.82 to 1.29), and decreasing for birth cohorts after 1953. In women, the birth cohort 1948–52 showed the highest relative risk, but there was no specific trend over time.
Age specific mortality rates (per 100 000 person-years) and relative birth cohort risks in an age-cohort model on observed mortality from pleural mesothelioma, 1969–98
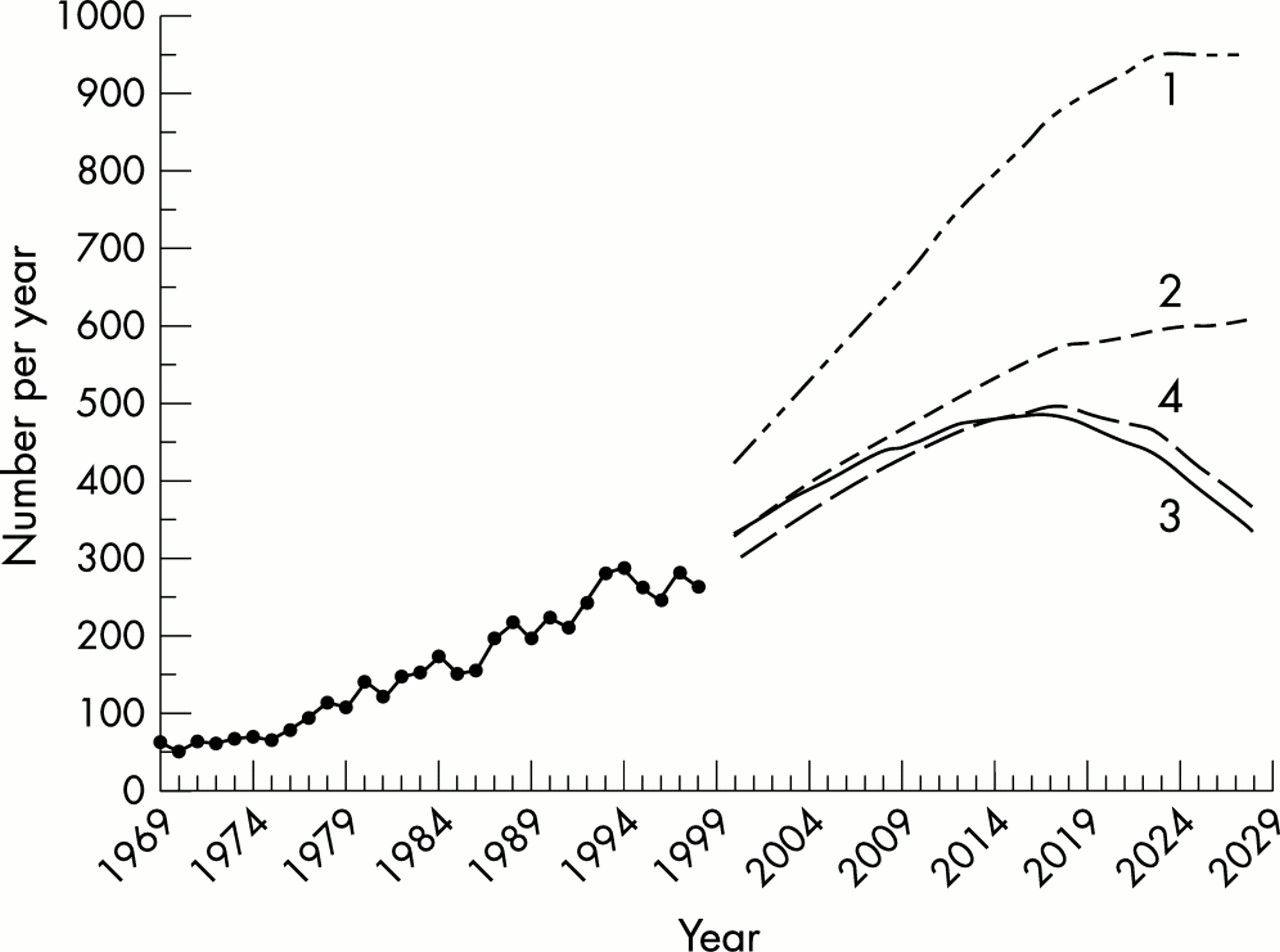
Figures 3 and 4 present the predicted number of deaths from pleural mesothelioma among men and women for 2000–28. As reference, the observed mortality from pleural mesothelioma in 1968–98 is included. The most plausible scenario, model 3, predicted an increase in pleural mesothelioma deaths from 333 cases in the year 2000 to a plateau of 490 cases in 2017, thereafter decreasing rapidly to 338 cases in 2028. The “old” model 1, based on mortality data from 1969 to 1993, predicted that the peak of annual deaths from pleural mesothelioma will occur between 2025 and 2030, with over 950 deaths. For women, all models were fairly similar and predicted a continuous decrease from 33 cases in 2000 to 15 cases in 2028.

Observed mortality from pleural mesothelioma among men in 1969–98 and predicted number of deaths from pleural mesothelioma among men for 2000–28, according to four prediction models described in table 1.

Observed mortality from pleural mesothelioma among women in 1969–98 and predicted number of deaths from pleural mesothelioma among women for 2000–28, according to four prediction models described in table 1.
Table 4 compares the peak number of deaths and total death toll from pleural mesothelioma between 2000 and 2028 among the four distinguished models. The sensitivity analysis showed that inclusion of an additional five years of mortality data in the development of the age-cohort model has a large impact on the predicted pleural mesothelioma mortality among men. In reference to model 1, model 3 predicted a 49% lower peak (470 cases) and a 44% lower total death toll (9649 cases). The assumptions on risks among birth cohort after 1953 were important, since model 2 predicted a 25% higher peak and a 20% higher total death toll compared with model 3. The small differences between models 3 and 4 illustrated the modest impact of the period effect in this modelling approach. For women, the four models showed comparable results, with model 4 predicting the smallest peak and total death toll.
Comparison of peak numbers of deaths and total death toll from pleural mesothelioma over 2000–28 according to four prediction models described in table 1
DISCUSSION
The mortality of pleural mesothelioma in men has increased from 65 cases in 1969 to 265 cases in 1998. The most plausible prediction suggests that the number of deaths will rise to 490 in 2017 and subsequently decrease rapidly. The total death toll between 2000 and 2082 is estimated to be over 12 000 cases. For women, the number of deaths from pleural mesothelioma will decrease from 33 cases in 2000 to 16 cases in 2028, with a total death toll of approximately 800 cases. In contrast to previous studies which used shorter periods of observed mortality, we predicted considerably fewer deaths and an earlier time of the death peak.6,9,14 The sensitivity analysis showed that assumptions in the age-cohort model may have a profound effect on these predictions.
The presented predictions on future number of deaths from pleural mesothelioma are strongly influenced by the assumptions behind the age-cohort model. A number of uncertainties can be identified, primarily concerning the quality of the available data for the predictions, choices in the statistical modelling techniques, and expectations about future developments in nature and size of the population at risk.
The first source of uncertainty to be discussed is the quality of the information on observed mortality from pleural mesothelioma. In the Mortality Registry misclassification of pleural mesothelioma cases as pleural cancer and vice versa is inevitable to a certain extent.7,8,22 The large number of unspecified mesothelioma deaths in 1996–98 were predominantly assigned to be of pleural origin. This was considered a reasonable approach since more than 60% of cases of unspecified mesothelioma could be pleural and more than 90% of pleural tumours were diagnosed as malignant pleural mesothelioma in the cancer registry.15 This approach is limited by unavailability of personal patient profiles, because of strict regulations on data protection in the Netherlands. Hence, a direct comparison between mortality and morbidity is not possible. However, for the period 1989–98 the total number of cases in the Cancer Registry and the Mortality Registry corresponded very well.6,15 However, uncertainty remains in the completeness of both registries. Although cancer registries have been criticised recently for lack of completeness,23 it was estimated that 95% of all cases are reported to the Cancer Registry in the Netherlands and that pathological confirmation of mesothelioma is about 90%.15
The strong increase in the male incidence rate of pleural mesothelioma in the period 1969–98, may also be affected by an increasing diagnostic awareness of mesothelioma over the past 20 years.9,10 Although the extent of this effect cannot be tested,15 the age specific rates were broadly proportional to the difference of age minus age at first exposure raised to the power 3.3, assuming an average age at first exposure of 25 years. This proportionality, together with the absence of a clear increase among women, provides some evidence against a strong impact of a diagnostic trend, as discussed elsewhere.10
A second source of uncertainty is the various choices made in the statistical modelling procedures. The effects of specific assumptions on the risk of birth cohorts after 1957 were shown in the sensitivity analysis. Model 2 forecasted a 25% higher peak and a 20% higher total death toll than model 3. This was explained by the fact that birth cohort risks were assumed to be constant at the risk of the birth cohort 1953–57. Since in model 2 the birth cohort risks will not decrease over time, the predicted mortality will level off at a plateau of over 600 deaths per year. It is suggested that this model is not a reasonable scenario because of the strong decrease in asbestos use after 1984 and a subsequent ban in 1993.12
However, uncertainty will remain for some time since the risks of birth cohorts 1958–62 and beyond cannot be estimated because of the small number of observed cases. Since these birth cohort risks are unknown, future mortality may vary between model 2 with a constant risk in birth cohorts after 1957 (unlikely because of the asbestos ban in 1993) and model 3 with assumed zero risk after 1957 (unlikely since not all asbestos exposure was eliminated in the 1980s).7–9 It is still too early to confirm whether asbestos control measures issued after 1977 have been effective. We agree with other experts to await at least five years more for a better appreciation of the change.8,9
The assumption of a constant pattern of age specific rates over the projected period has been recognised as a crucial premise on long term predictions.9,20 The effect of this assumption was illustrated by comparing model 1 with model 3. The inclusion of the latest mortality data 1994–98 added a substantial number of cases to model 3, especially among older age groups. As a result model 3 estimated comparable birth cohort risks to the previous model 1, but the age specific rates in the older age groups decreased by 15–60%. It is expected that the precision of the age specific rates in model 3 is higher than in model 1, primarily because of the larger number of observed deaths. This result clearly illustrates that these predictions go along with a high uncertainty. It will be of interest whether updated projections for other Western European countries will reveal a similar spectacular decrease in future mesothelioma deaths.24
The fit of the statistical models used calls for some caution in interpreting the results of the predictions. The choice between an age-cohort (AC) and age-period-cohort (APC) model is difficult to make. From a statistical point of view it is expected that an APC model would show a better fit, because an additional parameter was included. The period effect in model 4 may be the result of the introduction of the new codification ICD-10. Also, it may reflect the increasing awareness in the Netherlands of the health risks of asbestos exposure after the Stumphius study in 1969 and the first Guidance Note P-116 on asbestos.13 The latter was originally aimed at the asbestos industry and was issued to set personal protection and technical safety measures when dealing with asbestos. Alternatively, the period effect may reflect the calculation procedure used to obtain the pleural mesothelioma cases from the cases coded C459 (unspecified mesothelioma). However, when fitting other cut offs, such as 1993 or 1994, the goodness of fit was very similar (data not shown). The sensitivity analysis showed that the period effect used in APC model 4 differed little from the AC model 3. When considering the use of an AC model versus an APC model, we preferred the AC model because it was simple and fitted well. Since the disease pattern was reflected mostly by age and cohort effects rather than period effects, the non-identifiability problem was also avoided.19 The use of interaction terms has been studied previously.19,25 While such extensions to an APC model are theoretically possible, several authors do not recommend their use,19,25 or propose them only for investigating the adequacy of the assumption of common effects across the cohorts.19 Hence, a prediction based on an AC model was chosen, which also allows better comparison with results of other studies.6,8–10
A third source of uncertainty is the demographic development of the general population in the Netherlands during the period 2000–28. Future mortality is affected by population growth, specifically by the ageing process. The overall population in the Netherlands has increased about 25% in the past 30 years, with a clear shift towards the population older than 60 years. In the estimations of population growth in the Netherlands, the proportion of men over 65 years will increase from 10.4% in 2000 to 18.7% in 2028. For women a similar increase is to be expected, albeit with a higher proportion already in 2000. Since the age specific mortality rates for pleural mesothelioma are highest in the age groups over 65 years, the expected shift towards older age will considerably increase the predicted death toll. If demographics were to remain unchanged in the next 30 years, the estimated peak in deaths from pleural mesothelioma would appear slightly earlier and would certainly be at least 20% lower.
Main messages
-
Mortality as a result of pleural mesothelioma in the Netherlands was predicted to be 44% lower than previously estimated.
-
The demographic shift towards older populations is increasingly important for the incidence of pleural mesothelioma.
-
Predictions of future trends in mortality should be evaluated with regard to sensitivity to assumptions and uncertainties in the statistical modelling.
Policy implications
-
The large number of asbestos related deaths to be expected in the next 30 years warrants a stringent policy with regard to asbestos exposure.
-
It is advised to regularly update predictions of future trends in pleural mesothelioma mortality as more mortality data accrues.
Although the aforementioned sources of uncertainty apply to both men and women, women have to be considered separately. The age specific rates increased at much lower magnitude than in men. There were few differences among the four models and all models predicted a decrease in deaths of women after 2007. In the Netherlands, women have been far away from asbestos related activities and, thus, this is the main plausible reason for the small number of cases among women.6 However, it is unclear whether the occurrence of pleural mesothelioma among women may partly reflect the effects of environmentally related asbestos exposure.
In conclusion, the presented prediction updates the forecast of pleural mesothelioma mortality from 2000 to 2028, taking into account the latest available information on observed mortality. The death toll is predicted to be 44% lower than previously expected.6,9 The sensitivity analysis indicated that the predictions were most influenced by differences in age specific rates and, to a lesser extent, assumptions about the birth cohort risks. The ageing process in society, initial asbestos control measures, as well as changes of pleural mesothelioma coding, may also play a role in the predictions. The impact of these effects on the pleural mesothelioma mortality will be revealed over time. It is advised to update the predictions of mortality owing to pleural mesothelioma at regular intervals in order to keep track of the uncertainties in the current predictions.
Acknowledgments
This study was performed while the first author was pursuing a Master of Science in Clinical Epidemiology at the Netherlands Institute for Health Sciences, supported by the University Fellowship Program (UFP) of the Netherlands Organisation for Higher Education (NUFFIC).