Article Text

Abstract
OBJECTIVES To investigate the risk of silicosis among tin miners and to investigate the relation between silicosis and cumulative exposure to dust (Chinese total dust and respirable crystalline silica dust).
METHODS A cohort study of 3010 miners exposed to silica dust and employed for at least 1 year during 1960–5 in any of four Chinese tin mines was conducted. Historical total dust data from China were used to create a job exposure matrix for facility, job title, and calendar year. The total dust exposure data from China were converted to estimates of exposure to respirable crystalline silica for comparison with findings from other epidemiological studies of silicosis. Each worker's work history was abstracted from the complete employment records in mine files. Diagnoses of silicosis were based on 1986 Chinese pneumoconiosis Roentgen diagnostic criteria, which classified silicosis as stages I-III—similar to an International Labour Organisation (ILO) classification of 1/1 or greater.
RESULTS There were 1015 (33.7%) miners identified with silicosis, who had a mean age of 48.3 years, with a mean of 21.3 years after first exposure (equivalent to 11.0 net years in a dusty job). Among those who had silicosis, 684 miners (67.4%) developed silicosis after exposure ended (a mean of 3.7 years after). The risk of silicosis was strongly related to cumulative exposure to silica dust and was well fitted by the Weibull distribution, with the risk of silicosis less than 0.1% when the Chinese measure of cumulative exposure to total dust (CTD) was under 10 mg/m3-years (or 0.36 mg/m3-years of respirable crystalline silica), increasing to 68.7% when CTD exposure was 150 mg/m3-years (or 5.4 mg/m3-years of respirable crystalline silica). Latency period was not correlated to the risk of silicosis or cumulative dose of exposure. This study predicts about a 36% cumulative risk of silicosis for a 45 year lifetime exposure to these tin mine dusts at the CTD exposure standard of 2 mg/m3, and a 55% risk at 45 years exposure to the current United States Occupational Safety and Health Administration and Mine Safety and Health Administration standards of 0.1 mg/m3100% respirable crystalline silica dust.
CONCLUSIONS A clear exposure-response relation was detected for silicosis in Chinese tin miners. The study results were similar to most, but not all, findings from other large scale exposure-response studies.
- silicosis
- exposure to silica
- dose-response relation
Statistics from Altmetric.com
Silicosis remains a common occupational respiratory disease of workers exposed to dust around the world. Millions of workers are exposed to crystalline silica, whether they are employed in developed or developing countries. According to results from statistical surveys, about 1.9 million workers in the United States and more than 10 million workers in China are potentially exposed to silica dust.1 2 Cases of silicosis were first reported in the early 1950s in China, and the number of cases increased rapidly with the growth of industry and the absence of methods to control dust—for example, wet drilling and ventilation—before 1960.2 In 1992, 5779 new cases were registered, rising to 9871 in 1995.3 At the same time, because of the administrative and engineering controls instituted in workplaces where airborne silica dust occurs, silicosis had become less of a problem in developed countries such as the United States, Sweden, and Japan.1 4
In Chinese metal mines, silicosis is so common and severe that it is thought to be the main occupational disease. A greater than 30-fold excess of mortality from pneumoconiosis was found in a cohort study of 68 285 metal miners and pottery workers in China.5 In a subcohort of tin mine workers from that study, 58 deaths from silicosis were observed against 1.3 expected from national rates (standardised mortality ratio=4351).
Since the 1950s, the Chinese government has enforced systematic dust sampling regulations which require mines and companies in the dusty trades to measure the total dust concentration monthly in dusty work areas wherever exposure to silica was expected, to measure crystalline silica content in bulk dust if deemed necessary, and to report the results to higher administrative authorities quarterly. Over four decades of dust monitoring data are available for investigations. However, earlier investigations were limited to studies of lung cancer and mortality among pottery workers and iron, copper, tin, and tungsten miners. Also, few studies have been conducted to establish quantitative exposure-response relations among workers exposed to silica. Thus, the purposes of this study were to investigate the risk of silicosis in Chinese tin mines and to measure the relation between silicosis and exposure to cumulative dust (Chinese total dust and respirable crystalline silica dust) with implications for identifying protective exposure limits.
Methods
STUDY POPULATION
This study was designed as a retrospective cohort study. The cohort included 3010 miners exposed to dust (2795 men and 215 women) who worked for at least 1 year between 1 January 1960 and 31 December 1965 in any of four Chinese tin mines. The mean age was 26.8 years when they entered the cohort. Exposure and medical data were obtained from personnel and medical examination records for each employee. Each cohort member was followed up for a diagnosis of silicosis from the first employment to the end of 1994. The date of first exposure for some miners was after 1965, because they previously worked on non-exposed jobs. As it usually takes at least 1 year for a new worker to develop silicosis, the criterion of at least 1 year of employment was used to exclude miners with less than 1 year of exposure. It is also presumed that an exposure-response relation for acute accelerated silicosis would be different from that for chronic silicosis, in that acute accelerated silicosis needs short, intense exposures, whereas chronic silicosis requires long term, lower exposures. The 1 year criterion selected out those who rapidly developed silicosis and focused the study on the exposure-response relation for chronic silicosis. Compared with cohorts that could have been defined over earlier or later periods, this is the earliest cohort with nearly complete dust monitoring data, work history, and medical records. Most workers ever employed in these four tin mines were recruited during the 1950s and 1960s.
All four tin mines selected in this study are located in Guangxi province, China, and are underground mining operations. All mines have kept complete records of occupational history, dust monitoring data, and medical examination records since the early 1950s. Exposures before 1950 were estimated. Thus, it is possible to follow up miners for their working lifetime or to the end of 1994.
OCCUPATIONAL EXPOSURE DATA
Chinese industrial hygienists have been measuring and recording workers' environmental exposures to airborne dust and silica since the 1950s. Historically, concentrations of silica dust in exposed jobs have been high. Concentrations of Chinese total dust were dramatically reduced after wet dust suppression and ventilation systems were installed in all four tin mines in 1958.
The Chinese dust monitoring scheme is based on a gravimetric method for assessment of airborne concentration, a particle count method for size distribution, and a settled dust analysis for silica content. The Chinese airborne dust samplers are battery operated and collect total dust directly onto an exposed preweighed filter. Samplers were typically run during active working periods at a flow rate of 25 l/min, for about 15–20 minutes.6 After sampling, the filters were weighed to measure the Chinese total dust concentration.
To develop retrospective exposure estimates, a job title dictionary was first made for major activities in the mines (underground mining, open cast mining, ore separation processing, and other activities). Then, job titles in the dictionary were classified into jobs with and without exposure to dust. All available industrial hygiene data were used to create a facility, job title, calendar year exposure matrix. From 1950 to 1986, Chinese total dust concentrations and exposure duration (number of hours) per shift were summarised for each facility/job title in 3 year intervals. Concentrations of exposure to Chinese total dust and duration of exposure per shift were measured every year after 1986. The concentrations of exposure before 1950 were estimated from the monitoring data for 1950. About 50% of the facility, job title, calendar year combinations of the job exposure matrix were estimated based on direct monitoring data. The others were estimated with monitoring data for similar jobs, or data for the same job at different times, with adjustment for other historical exposure information and task description of the job title. To do this, consensus estimates were made by industrial hygiene experts, public health doctors, safety engineers, samplers, and local supervisors, based on the history of control measures, major changes in technical processes in the mines, and comparisons with the other jobs. The job exposure matrix is a modified version of that originally formulated by Dosemeciet al for a nested case-control study of lung cancer among pottery and mine workers exposed to dust containing silica.7
Each person's work history was abstracted from their complete employment records in mine files. These records include job titles and calendar work years for miners' full duration of employment. Chinese data on exposure to CTD were calculated for each person with the following equation:

where CTD=Chinese data on cumulative exposure to total dust (mg/m3-years), n=number of job combinations held by the subject in the work history, Cj=8 hour time weighted mean concentration of total dust (mg/m3) for the jth job and employment period (from the job-exposure matrix), and Tj=duration of employment (years) in job j.
For people without silicosis, exposure to CTD was calculated from the start of mining to the end of employment or to the end of 1994. For people with silicosis, exposure to CTD was calculated to the time of first diagnosis by radiography. For subjects that were lost during the follow up period, their exposures to CTD up to the time they were lost were also used to calculate the cumulative risk.
The mean dust concentration for each study subject was calculated by dividing CTD by net years in a dusty job. One net year is defined as 8 hours a day and 270 days a year. This is done because these workers often had much shorter work shifts than 8 hours. Net years in a dusty job was calculated with the following equation.

where n=number of job combinations held by the subject in their work history, Tj=duration of employment (years) in job j, and Hj=average duration of exposure (hours) per shift in job j.
To apply the Chinese data in judging the appropriateness of current standards for respirable crystalline silica in the United States, it is necessary to express the exposure variable in terms of concentrations of respirable crystalline silica. For comparison with results from other studies, the same exposure variable conversion is needed. Thus, the Chinese estimates of exposure to CTD were converted to exposure to respirable crystalline silica. The concentration of respirable crystalline silica was estimated to be 3.6% (SD 2.5%) of the Chinese total dust (mixed mine dust) concentration in tin mines.6This estimate was based on side by side airborne dust samples collected with American nylon cyclones and traditional Chinese samplers in the tin mines in a special sampling survey during 1988–9. The conversion factor between Chinese traditional dust samples and American measurements of respirable crystalline silica was the ratio of the concentration of respirable crystalline silica obtained from each cyclone sample to the paired total dust concentration measured by the Chinese airborne dust sampler during the special 1988–9 sampling survey. The concentration of respirable crystalline silica converted from the Chinese total dust concentration was equivalent to a full shift, time weighted average concentration for the actual duration of the work shift on that day. The conversion factor at each facility was obtained by averaging the ratios of the concentrations of respirable crystalline silica to that of the Chinese total dust over sampling sites within the facility, and the industry wide conversion factor was obtained by taking the same average over all sampling sites for facilities within the industry. The conversion factor of 3.6% was applied to the Chinese data on exposure to total dust to establish a dose-response relation which can be compared with those from other studies.6
SILICOSIS DATA
Since 1963, workplaces with exposure to silica in China, have been required by a national law to keep registries of employees with silicosis. Yearly radiographs have been taken of workers exposed to dust since then, and diagnoses of silicosis are included in the silicosis registry. Diagnoses of silicosis made before the silicosis registry law became effective in 1963 were also included in the silicosis registry. All cohort members continued to be examined and radiographed every 2–3 years even after exposure ended.
Chest radiographs for each cohort member were kept by hygienists in all four tin mines. In 1989, 12 Chinese professional radiologists from different institutes in south central China were divided into four groups to read all chest radiographs. The diagnoses of silicosis were defined by at least two of three radiologists who used the 1986 Chinese pneumoconiosis Roentgen diagnostic criteria, which classified silicosis as suspected or at stage I, II, or III.8 Only cases with a diagnosis of stages I–III were considered to have silicosis in this study. A panel of three Chinese radiologists at a hospital affiliated to Tongji Medical University read chest radiographs obtained after 1989 with the same 1986 Chinese pneumoconiosis Roentgen diagnostic criteria.
In 1991, a comparison was made between the results of classification of 150 chest radiographs of 75 Chinese and 75 American workers according to the standard Chinese classification system (1986) and the International Labour Organisation (ILO) criteria (1980).8-10 The Chinese “suspected case”, stage I, II, and III were found to agree closely with ILO profusion category 0/1 for small opacities, category 1, category 2, and category 3, respectively. There was a valid correspondence (agreement on the major category of 67%) between the Chinese classification system and American interpretation that used the ILO criteria (1980).10 Of the 150 radiographs, 51 were found to be normal (without silicosis) by both systems. The agreement between the Chinese classification system and ILO classification was 89.3% in detecting the presence or absence of silicosis.10
ANALYTICAL METHODS
The statistical analysis system (SAS) procedure, PROC LIFETEST, was used to fit survival distributions. After assessment of the mean, scale, shape variables, and survival function estimates, the Weibull model seemed to best fit the survival distributions.11 The cumulative risk can be estimated by the accelerated failure exposure as follows.

where CR(x)=cumulative risk, x=Chinese data on CTD exposure from the at the end of follow up or occurrence of silicosis, α and β are the Weibull scale and shape variables, respectively, estimated by the SAS PROC LIFEREG procedure. Chinese data on CTD exposure were defined previously in equation 1. Cumulative risk is defined as the percentage of a population, exposed to a given value of the Chinese data on CTD exposure, who develop silicosis.
Results
Cohort status is summarised in table 1. At the end of 1994, 400 (13%) miners were still working in the tin mines, 184 had left for other jobs, 1593 had retired, and 833 had died. Only 16 miners (<1% of the cohort) were lost to follow up after they left work in the tin mines. Of all cohort members, 1015 (33.7%) were diagnosed to have silicosis. Among those who had silicosis, 684 (67.4%) miners developed silicosis after exposure ended (a mean of 3.7 years after). Current workers had relatively low levels of silicosis, compared with those who had retired or died.
Cohort data at the end of 1994
Distribution of silicosis based on the Chinese classification system is summarised by silicosis stage in table 2. The age and year of first exposure and the Chinese data on CTD exposure for each corresponding stage of silicosis are also provided in the table. With increasing degree of silicosis from I to III, CTD exposure increased from 87.7 mg/m3-years to 126.3 mg/m3-years. Of the 1015 cases of silicosis, 50% were in stage I and only 13% were in stage III.
Distribution (mean (SD)) of silicosis by stage and Chinese data on cumulative exposure to total dust (CTD))
Table 3 provides a detailed comparison of year and age of first exposure between workers with and without silicosis. In general, miners with silicosis started exposure earlier than those without (94% before 1960 for cases with silicosis compared with 67% before 1960 for those without). The distributions for year and age at first diagnosis are also shown in table 3. There was a low percentage in the first calendar period (1956–9), and the percentage was 16.1% for the period during which the radiography programme was introduced. There was a jump to 37.4% during 1980–4. This could be explained by the fact that most workers started exposure around 1960 and it usually takes 20 years or more to develop silicosis.
Distribution (n (%)) of cases with and without silicosis by year and age at first exposure and first diagnosis
Table 4 gives characteristics of workers exposed to dust by silicosis status, year of birth, age, and year of first exposure, exposure dose, etc. The mean CTD exposure was 64.7 mg/m3-years for the 3010 miners. By contrast with all workers, those with silicosis had higher mean CTD exposure (99.7 mg/m3-years) and spent more net years in dusty jobs (11.0 compared with 9.6 years for all 3010 miners). For the 1015 miners who developed silicosis, the mean latency period was 21.3 years and the mean age at onset of silicosis was 48.3 years. Their mean age of leaving work was 54.0 years. There were a considerable number of age and time differences between workers with and without silicosis as shown in tables 3 and 4. Many of these differences are consistent with the higher level of dust exposure before wet dust suppression and ventilation systems were installed in all four tin mines in 1958.6
Characteristics of workers exposed to dust with and without silicosis
Table 5 shows the cumulative risk of silicosis by CTD exposure (mg/m3-years). The number of cases and miners who were at risk, net years in a dusty job, and latency periods are also provided in the table. The cumulative risk of silicosis increased from 0.001 to 0.917 with the increase of CTD exposure from <10 mg/m3-years to ⩾150 mg/m3-years. The mean net years of exposure also increased from 2.2 to 15.7 years with the increase of CTD exposure from <10 mg/m3-years to ⩾150 mg/m3-years. Thus, risk of silicosis seemed to be related to net years in a dusty job and CTD exposure. However, risk of silicosis did not seem to be correlated with latency period.
Cumulative risk of silicosis by Chinese data on exposure to CTD
The cumulative risk estimated by the Weibull distribution model is illustrated in figure 1. The coefficients of the distribution were estimated to be α=0.0076 and β=2.23 (equation 3). The cumulative risk of silicosis was 0.1% when CTD exposure was 10 mg/m3-years, and it increased to 10% with 50 mg/m3-years of CTD exposure. The cumulative risk of silicosis reached 68.7% when CTD exposure was 150 mg/m3-years.

Relation between cumulative risk of silicosis and Chinese data on cumulative exposure to total dust.
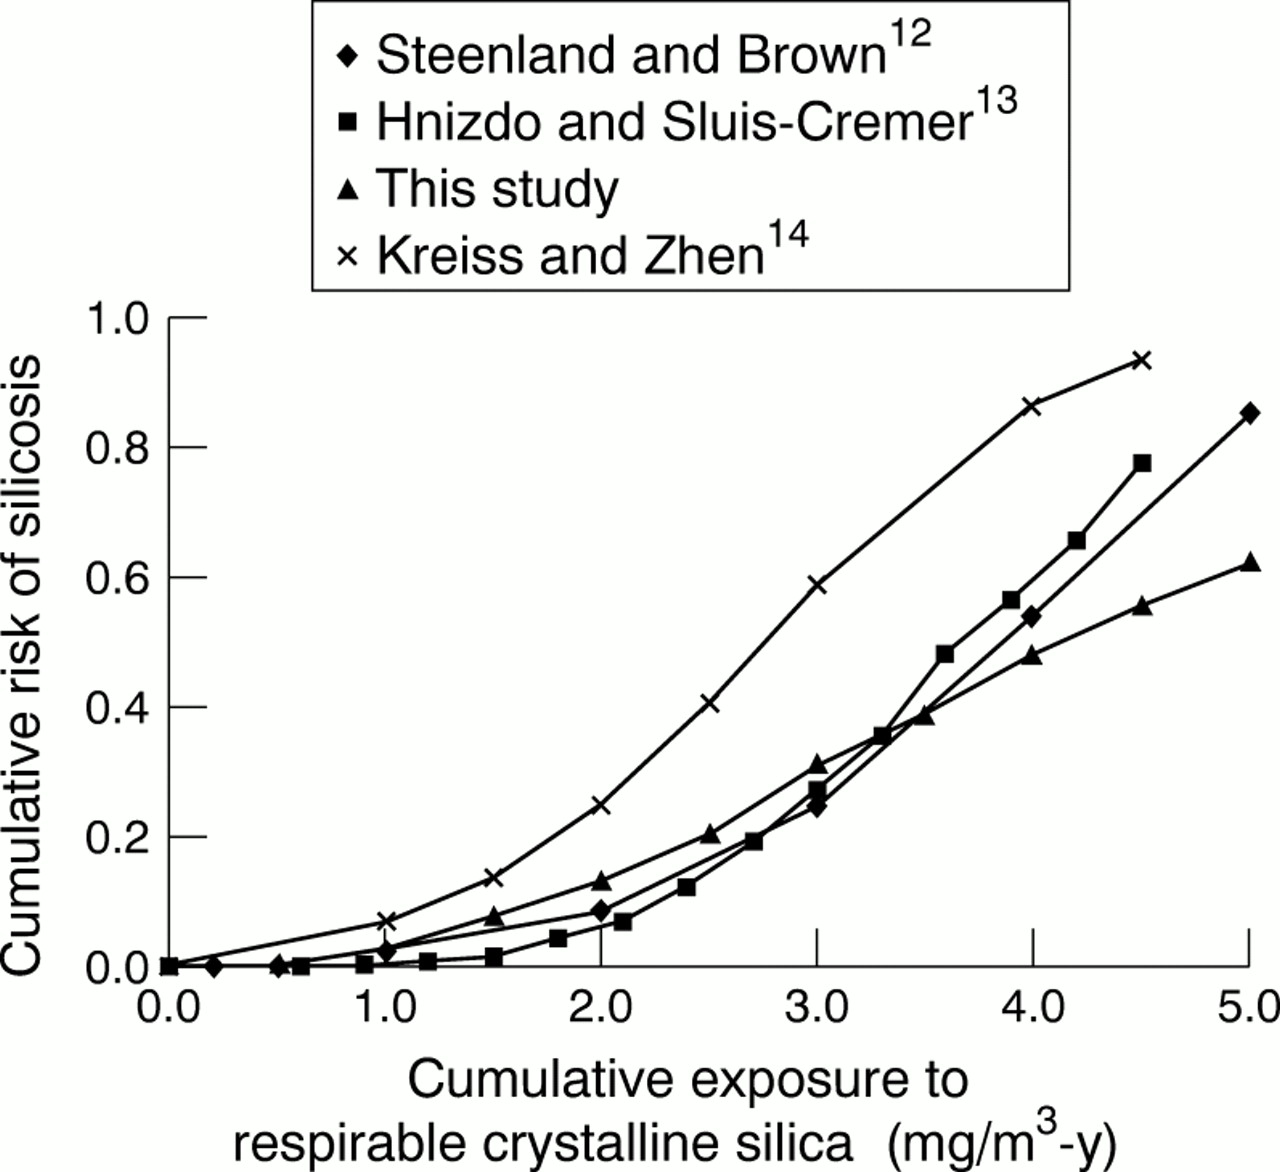
To illustrate the effect of cumulative respirable crystalline silica dust and to compare these study results with those from other studies, the Chinese total dust was converted to respirable crystalline silica dust as noted in the methods section.6 The relation between cumulative risk and cumulative respirable crystalline silica dust is shown in figure 2, together with that from comparable studies. With the estimates of respirable crystalline silica dust being 3.6% of the Chinese total dust, to calculate the cumulative dose of respirable crystalline silica, the range of exposure in the tin mines was about 0.2–6 mg/m3-years. The risk of silicosis is predicted to be 55% with 4.5 mg/m3-years of cumulative exposure to respirable crystalline silica.
Cumulative risk of silicosis versus cumulative exposure to respirable crystalline silica.
Discussion
In this study, 1015 tin miners in a cohort of 3010 were diagnosed to have silicosis. Exposures in the cohort started as early as the 1920s, with most starting before 1960. The mean age at onset of silicosis was 48 years, after a mean of 21 years from first starting exposure and a mean of 11.0 net years in a dusty job. The cumulative risk of silicosis increased with CTD exposure. When this exceeded 20 mg/m3-years as measured in these mines, the increase in cumulative risk of silicosis was accelerated. Risk of silicosis estimated by the Weibull distribution was greater than 68% when CTD exposure reached 150 mg/m3-years.
Three recent studies of the relation between exposure to silica and incidence of silicosis have used similar methods to the ones used in this study.12-14 The results from those studies and from this study are presented in figure 2. It can be seen that our results are very similar to those of the other three studies.
On the other hand, there are three other published studies in which the estimated cumulative risks of silicosis were much lower than those seen in figure 2.15-17 Table 6 summarises the findings from all published studies, with the exception of one, which could not be included because the units of measurement of silica were different.18 The cumulative risks in table 6 are for a risk of silicosis of category 1/1 or above, after 45 years of exposure at 0.1 mg/m3 respirable crystalline silica.
Lifetime risk of silicosis (at least 1/1) by concentration of exposure in various studies
The key point to be taken from the table is that the estimated cumulative risk was heavily dependent on the extent of follow up after leaving work. In the studies by Muir et al 15 and Rosenman et al 16 there was virtually no follow up after leaving work, and their predictions were much lower than in those studies with follow up after employment. It is known from our work and that of others that silicosis commonly develops after leaving employment. The clear implication of the results in table 6 is that studies based on data collected only on employed workers may grossly underestimate the incidence of silicosis.
There are other reasons for different findings between studies, but they are likely to be less important than the duration of follow up. Different diagnostic methods for detection of silicosis were used in different studies. The fraction of respirable crystalline silica in total dust and its estimation methods were different among different studies. The silica in different studies is likely to have had different surface properties, which may influence toxicity.19 Also, variations in modelling approach, variations in methods of estimating exposure, and the uncertainties inherent in estimating the concentration and duration (number of hours) of exposure per shift, may have resulted in differences between studies.
Despite the differences among the studies, there is consistent evidence that exposure at the current United States Occupational Safety and Health Administration (OSHA) and Mine Safety and Health Administration (MSHA) permissible exposure limits of 0.1 mg/m3 for 100% respirable crystalline silica dust is not protective against silicosis. When the OSHA and MSHA standards were used to estimate the lifetime risk of silicosis for tin miners exposed to respirable crystalline silica dust for 45 years (4.5 mg/m3-years of cumulative respirable crystalline silica), the cumulative risk of silicosis was 55% (fig 2). The same is true for the Chinese situation. When free silica is greater than 10%, the Chinese total dust standard is 2 mg/m3. This concentration is associated with a cumulative risk of 36% for tin miners with 45 year lifetime exposure (fig 1). If the lifetime risk of silicosis is to be under 1 in 1000 (a criterion used by OSHA) for a lifetime exposure of 45 years, then the mean Chinese total dust concentration must be lower than 0.14 mg/m3 (or lower than 0.005 mg/m3 respirable crystalline silica). A workplace that consistently meets a standard has a lower mean dust concentration than the standard, so a dust standard higher than 0.005 mg/m3 respirable crystalline silica might be protective.20 Greaves has recently summarised the literature and suggests that 0.01 mg/m3 silica would be a reasonable standard to prevent disease.21
There were four limitations worth mentioning in this study. Firstly, the actual concentrations of Chinese total dust before 1950 are not known. Instead, industrial hygienists, public health doctors, and safety engineers who were familiar with the mines estimated the exposures based on the data of 1950. However, only 5% (101 workers with silicosis and 57 without) of cohort members were first exposed to silica dust before 1950. The potential bias associated with cumulative exposure estimates for these miners may not be significant. It should be noted that the Chinese total dust exposure estimates for the period 1950–94 were based on thousands of dust samples; this suggests good precision for these values for that period.
Secondly, the Chinese silicosis registry law became effective in 1963 and the yearly radiography began around that time. It is possible that there was a delay in detecting some early cases. The cumulative exposures for these early cases may have been overestimated. However, only 8% and 16% of 1015 cases were first diagnosed during 1956–9 and 1960–4, respectively. The number of cases with overestimates of exposures is thought to be very few. Also, the Chinese diagnostic system classifies suspected cases before stage I. The suspected cases are usually monitored closely and many cases have records documenting the progress from suspected to stages I, II, and III. Workers were usually moved from exposure when they had stage I silicosis.
Thirdly, conversion of Chinese total dust measurements into exposure to respirable crystalline silica values used a single factor of 3.6%. This factor was developed by a few comparative workplace measurements in 1988–9. These used same shift sampling by the Chinese total dust and United States respirable dust methods, and a comparison of the Chinese phosphoric acid gravimetry and the United Statesx ray diffractometry methods for silica analysis.6
Fourthly, most miners came into the cohort period of recruitment (1 January 1960 to 31 December 1965) with a significant mining work history (table 3). If miners had either died or moved to other occupations due to ill health caused by exposure to silica before this period, then they would have removed themselves from observation and never entered the study. The impact of this exclusion could be that miners more sensitive to the effects of silica were excluded from recruitment into the study, and this potentially caused a biasing of quantitative measures of association. Those early workers who survived to 1960 might be expected to have a relatively low risk of silicosis. Thus, the risk may have been underestimated. To investigate this problem, we excluded from the cohort 158 miners with exposure before 1950, and recalculated risk. Similar results for the cumulative risk of silicosis were obtained. Those with CTD exposure of 90 mg/m3-years had a risk of silicosis of 39% compared with the original estimate of 36%. The predicted risk of silicosis increases slightly from 55% to 60% with 4.5 mg/m3-years of cumulative exposure to respirable crystalline silica.
In summary, the results from this study, which are based on over 1000 cases of silicosis and many thousands of dust measurements, indicate a clear exposure-response relation between cumulative exposure to silica and silicosis. This study predicts about a 36% cumulative risk of silicosis for a 45 year lifetime exposure to these tin mine dusts at the Chinese total dust exposure standard of 2 mg/m3. The Chinese total dust exposure data converted to respirable crystalline exposure to silica estimates (which introduces additional uncertainty into the exposure estimates) showed that the results were similar to most, but not all, findings from other large scale exposure-response epidemiological studies of silicosis. When the OSHA and MSHA permissible exposure limits of 0.1 mg/m3 was used to estimate the lifetime risk of silicosis for tin miners exposed to respirable crystalline silica dust for 45 years (4.5 mg/m3-years of exposure to cumulative respirable crystalline silica), the cumulative risk of silicosis was 55%.
Acknowledgments
We thank Dr Kyle Steenland for providing comments and some of the data for table 6, Dr Sidney Soderholm, Patricia Schleiff, Rebecca Stanevich, Dr Kathleen Kreiss, Dr Dan Sharp, and Dr Richard Monson (Harvard School of Public Health, Boston, MA) for reviewing the manuscript and providing many valuable comments during the internal review process required by the National Institute for Occupational Safety and Health. We also thank Dr Chen Rongan at Tongji Medical University and leaders and industrial hygienists in the four tin mines for participating in this survey.