Article Text

Abstract
STUDY OBJECTIVE Although perceived health status is an indicator widely used in epidemiological studies, its relation to various diseases is not well known. The objective of this study is to examine these relations in detail.
DESIGN Marginal models used for a longitudinal study of the association between three health scales and 47 diseases among 12 164 men and 44 diseases among 4415 women.
SETTING French Gazel cohort during the period from 1991 to 1996.
MAIN RESULTS The general health status scale was significantly associated with 43 diseases among men, and 31 among women. Some of these significantly associated diseases were physical (for example, cancer and cerebrovascular accident) and others, psychological (for example, depression). The mental fatigue scale was more specifically associated with psychological disorders, including sleep problems, depression, and nervous diseases. Moreover, modifications in subjects' assessment of their health from one year to the next were generally associated with modifications in reported diseases.
CONCLUSION Although the mechanism that relates the presence of a disease to perceived health status remains in question, these results show clearly that there is a close association between these two domains that justifies the use of perceived health as a proxy for self reported diseases.
- marginal model
- health scale
- self rated disease
Statistics from Altmetric.com
Many epidemiological studies have reported an association between self rated or perceived health status and mortality from all causes1-4; over 20 of them, published in the 1990–96 period, were examined in a review paper.5 Other authors have studied how perceived health status might be associated with the use of health services4 and with specific pathological conditions, especially chronic diseases such as musculoskeletal,6 cardiovascular,7 8 and psychiatric disorders.7 9 10 However, studies of the associations between acute health problems and perceived health status are rare.
The accumulation of results showing the association of various diseases with perceived health status in different countries and among different age groups has increased interest in this type of health indicator and raised new questions about these associations. Perceived health is usually assessed either by a 3 unit to 5 unit rating of general health status,11-13 or by a scale4 that allows an estimation of the perceived general health status. Although its precise links with the presence of specific diseases are still not well known, the concept of perceived health status is widely used today.11 12
The objectives of this study were to examine: (1) the longitudinal associations between a large range of diseases and perceived health status, as assessed by three different scales: general health status, physical fatigue, and mental (for example, emotional, psychological) fatigue), and (2) the effect of the course of these diseases on the value of the three perceived health scales.
Methods
The study population was the Gazel cohort, which was set up in 1989 and originally included 20 624 subjects working at the French national gas and electric company. This firm employs approximately 150 000 people, of very diversified trades and socioeconomic status throughout France. Epidemiological observations in this firm benefit from the population's stability; the employees have a status comparable to that of civil servants and can be followed up after retirement, for their pensions are paid by the firm. The company has an occupational medicine department and its own medical insurance system, both of which systematically monitor employees' health. They have constructed an epidemiological database that allows exhaustive recording of the most important health disorders and occupational exposures. The personnel department maintains a file that includes the employees' socioeconomic and occupational characteristics. The epidemiological profile of this population is very close to that of the French general population: the proportions of disorders and causes of death and the socioeconomic, occupational and geographical disparities are almost identical for both. At baseline, the cohort comprised men aged 40–50 and women aged 35–50 and has been followed up since 1989 by a yearly self administered questionnaire and by the collection of data extracted regularly from the files of the personnel and medical departments of the company. These files include demographic, socioeconomic and occupational data, medical absenteeism data, incident cancers and causes of death. The methods used to recruit, follow up, and collect data from the Gazel cohort have been described previously.14 15
The yearly questionnaire included a list of diseases and symptoms (table 1), covering a wide range of chronic and acute health problems: the subjects were asked to put a check mark next to those from which they had suffered over the past 12 months.
List of diseases and symptoms
Perceived health status was assessed by three different health scales: How do you judge your current overall health? Are you physically tired right now? Are you mentally tired right now? These questions used three 8 point visual analogue scales on which the subjects assessed their health as somewhere between very good (or not at all tired), scored as 1, and very bad (or very tired), scored as 8.
The first objective of the study was to investigate potential associations between reported diseases and the values of the perceived health scales. For example, we looked for the estimation of the increase of the health status scale for those who declared suffering from cancer compared with the subjects free of cancer.
These associations were studied using marginal models,16which are especially appropriate for the analysis of longitudinal data. These models allow all the information obtained from all the subjects to be analysed, while at the same time taking into account the correlations between the observations for each individual subject. The model is:

where t = 0,...,5 represents the years from 1991 to 1996, j = 1,...,p the diseases, and i = 1,...,n the subjects of the Gazel cohort; Sit represents the mean value of the health scale score considered for subject i in year t, and Pj it is a variable equal to 1 if subject i reported disease j in year t and otherwise, 0.
In model 1, the αj coefficients are the parameters of interest in our study. The coefficient αj, which measures the association between the presence of disease j and the perceived health status, represents the mean increase in the score associated with the report of disease j after adjustment for time and other reported diseases. For example, for subjects reportedly suffering from cancer, the associated coefficient αj represents the increase in the perceived health status scale as compared with that of subjects free of cancer.
The other parameters of model 1 are α0 and αc, which represent respectively, the mean of the perceived health scale in 1991 (t=0) and the mean trend of the perceived health scale from one year to the next, after adjustment for the reported diseases.
The second objective of our study aimed at evaluating the effects of the trend of the diseases on the three health scales. For example, in the case of depression, four situations are possible: depression unreported for two consecutive years (reference), depression not reported one year and reported the next year (situation 1), depression reported one year and not reported the next year (situation 2) and depression reported for two consecutive years (situation 3). The differences in the variations of the health status scales for the three situations compared with the reference situation were evaluated using the following marginal model:

where Tit = Si(t+1)—Sitrepresents the mean variation of the health scale score for subject i between year t and year t+1. We coded the variations in reporting disease j between year t and year t+1 with three binary variables, Uj it, Vj it and Wj it: for each subject i and disease j, 1 was the value of Uj it if the subject did not report it in year t and did declare it the following year, of Vj it if it was reported in year t and not the next year, and of Wj it if it was declared both years. Each variable was otherwise equal to 0.
In this model, β0 represents the mean variation of the health scale score in two consecutive years during which no disease was reported (reference situation); βj1 represents the mean variation of the health scale score associated with the absence of disease j the first year, followed by its presence the next year; βj2 is the variation associated with a report of disease j followed by its absence the next year; βj3 is that associated with its presence two years in a row, after adjustment for changes in other diseases and compared with the reference situation. For example, the coefficient βj1 for the depression represents the difference in the variation of the health status scale between two consecutive years for situation 1 with respect to the reference situation; the coefficients βj2 and βj3 represent similar variations for situation 2 and 3 with respect to the reference situation.
Because of the large number of subjects and diseases included in the study, and in view of the great number of statistical tests that were performed, we could have been led to consider too weak or spurious relations between self reported health conditions and scores values, if we relied only on statistical significance. Therefore, we considered only the results for diseases significantly associated with score values for which the α coefficient was above a threshold value, reflecting a minimal increase of the score value associated to the reporting of a disease. For analyses conducted using model 1, we chose a threshold value of 0.25 point in the scale (which values can vary from 1 to 8) for the general health scale, and a threshold value of 0.13 for the mental fatigue scale; these values were chosen as cut off points for selecting the most important associations. For model 2, we considered only the diseases selected according to these thresholds while using model 1.
As the main possible confounders and effects modifiers for health status are gender, age and socioeconomic status, the analyses were performed with and without adjusting for age and socioeconomic status, and the three health scales were studied separately among men (n = 12 164) and women (n = 4 415).
We considered only those diseases reported by at least 20 subjects (47 different diseases for men and 44 for women). The longitudinal analysis involved the six annual questionnaires containing a common list of diseases collected for the 1991–1996 period. The marginal models were adjusted to the data using the GENMOD procedure of SAS software.17
Results
key points
-
In epidemiological studies, perceived health status has been widely used although its relation with morbidity was not clear.
-
Assessment of statistical associations between perceived general health status scale and more than 40 self reported diseases.
-
Assessment of statistical associations between perceived mental fatigue scale and psychological disorders.
-
The health scale scores longitudinally reflect the evolution of the health status: increasing or decreasing regarding the report of diseases.
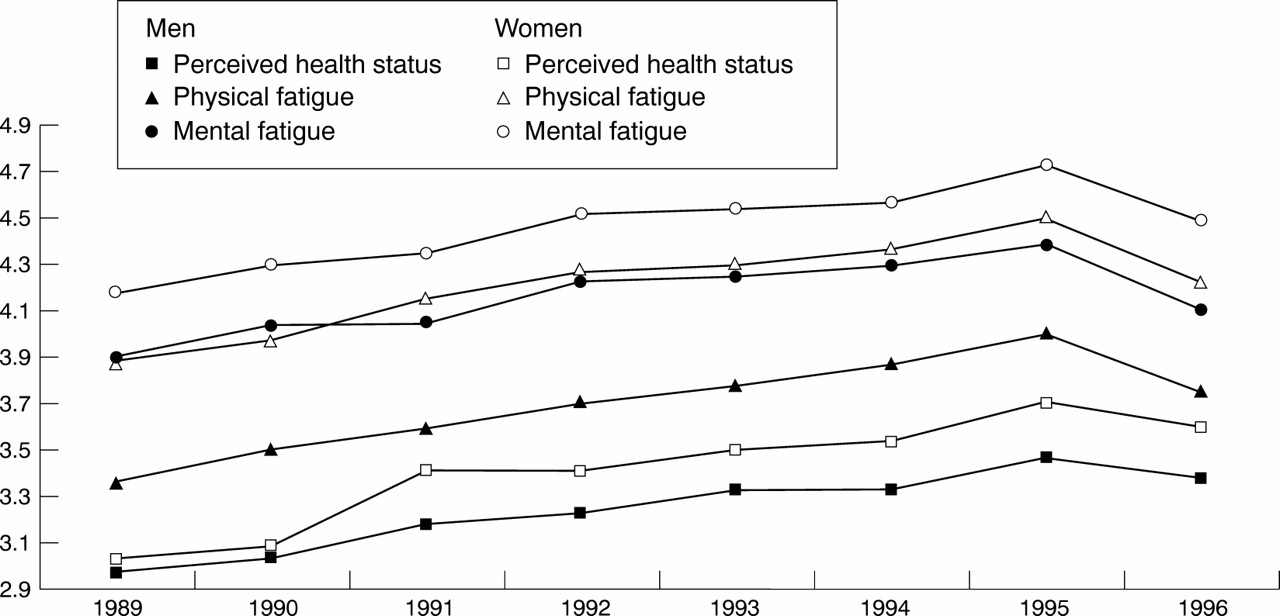
Figure 1 shows the trend of the mean scores for the three health scales annually from 1989 to 1996. For each score, and both sexes, subjects considered that their health status worsened progressively over time, except in 1995–96 where it especially worsened in 1995 and improved in 1996. The women judged their health more severely than men did.
Course of health status scales.
For each of the reported diseases, the mean increase in the health status was estimated using model 1 adjusted for time and all other reported diseases. Because age and socioeconomic status introduced in model 1 as cofactors led to small changes in the results, table 2 shows the results after adjustment for time alone. Effects modifiers for age and socioeconomic status were also studied, leading to either weak effects or effects with doubtful statistical significance, in view of the large number of statistical comparisons.
A Mean increase of the general health status scale associated with the report of a disease (time adjusted)
Table 2 presents the results of model 1 for reported diseases corresponding to the largest significant variations in mean score values (increase of the α coefficient above the chosen threshold).
The results of model 1 are presented in table 2 separately for men and women and for only two of the three scales, namely general health status (table 2A) and perceived mental fatigue (table 2B), as the results for physical fatigue showed small differences with those of each other scale.
The highest coefficients of table 2 show that the general health status and the mental fatigue scales are similar for men and women and differ according to some specific diseases. But for both sexes, the mental fatigue scale is strongly associated with reported mental symptoms: depressive symptoms, sleep disorders and other nervous disorders, whereas the general health scale is strongly associated with cancer, cerebrovascular accident, other cardiac diseases, phlebitis, epilepsy as well as depressive symptoms and other nervous disorders.
Some other diseases present a lower coefficient or are associated with the scale for only one gender. It is, for example, the case for diabetes, hypertension and myocardial infarction with general health status, and for migraine, stomach or duodenal ulcer and psoriasis with mental fatigue.
The other diseases were more weakly associated with the health scales, presenting only small variations of the α coefficient. Altogether, for general health status, the association was significant for 43 of 47 diseases included in the study among men and, for 31 of 44 diseases among women. For mental fatigue, the association was significant for 26 of 47 diseases among men and 20 of 44 among women.
Table 3 summarises the results of the second model. The coefficient represents the modification of the value of the health scale score in three situations, all in relation to the reference situation in which the disease was not reported for two consecutive years: (1) when the disease was absent one year and present the next year; (2) when it was present one year and absent the next year, and (3) when it was reported two years in a row. For both sexes and all three scales the results, for most of the diseases included in the study, showed that perceived health worsened from one year to the next when a disease reported one year had been absent the preceding year, and improved when the disease reported one year was gone the following year. That is, in general we observed a positive coefficient in the first case and a negative coefficient in the second. The diseases that did not fit this pattern were primarily those that were not significantly associated with the health scale in the first model. There were none the less several exceptions: for example, for men and the general health status scale, when gout, glaucoma and psoriasis apparently disappeared after a year, perceived health did not improve.
A Course of diseases: variation differences in the general health status scale between two consecutive years
Table 3 also shows the variation of the perceived health score when a disease was reported two years in a row, in comparison with the reference situation when it was absent two years in a row. This coefficient was much more unstable, sometimes positive, sometimes negative. None the less, for the diseases strongly associated with the health scale in the first model, this coefficient was always smaller than the coefficients of perceived health scores when the disease was absent one year and present the next year, or vice versa. This is the case (table 3A) for cerebrovascular accident and cancer.
Discussion
These results, based on a large sample of men and women with varied occupations throughout France, showed a close association between the perceived health scales and most diseases reported by the subjects. Both cross sectionally and longitudinally, throughout the six year period of observation, subjects with diseases perceived their health status as less good than did subjects without those diseases. Moreover, the changes in perceived health move in the same directions as the changes in the reported diseases. But the limitation of the sample to a single age group (10 years for the men and 15 for the women) limits the generalisation of the results. The smaller sample of women may partly explain the fewer significant results observed among them.
A strong feature of this study is its longitudinal nature: over a long period, we collected annual data about a wide variety of reported diseases. The statistical method used in this study allowed to take into account the data gathered at different points in time. Moreover, the method allowed all the information contained in the health scales to be used in the analyses without having to collapse their values into categories.
Not all subjects of the cohort did complete each yearly questionnaire. The analysis of missing data (results not shown) indicates that the perceived health for the subjects who did not respond in a given year was worse than the perceived health of those who answered. Thus, the perceived health of the entire population worsened more during the study period than could be observed from the available data. On the other hand, the estimations of the coefficients of marginal models, measuring the associations between the scales and the reported diseases, are unbiased under the assumption that the data are missing completely at random.18 This hypothesis has not been verified here, but the relation between perceived health and self reported diseases, is unlikely to vary according to whether or not the subject responds to the questionnaire.
On all three scales, perceived health clearly deteriorated for respondents in the Gazel cohort from 1989 through 1995; none the less, perceived health improved in 1996. A possible reason for this improvement could have come from the increased proportion of retired subjects in the cohort (20.9% in 1994) as becoming retired could modify the perception of health status. When adjusting for retirement, improvement of health status was no longer observed in 1996, whereas a clear deterioration was noted for 1995. A possible explanation for this phenomenon could be a response set effect, as in the 1995 questionnaire, unlike the other years, the health status rating followed immediately a series of questions about perceived working conditions adapted from the Karasek model.19
This study relied on self reporting of health problems. The validity of the self reported diseases in the Gazel cohort was examined with respect to independent data used as reference, namely medical causes of sick leaves. This previous study20 reported that (1) there was in general a good agreement between self reported and medically diagnosed diseases; (2) neither socioeconomic status nor age seems to have an important impact on the reporting of morbidity, but gender was found to be an important factor, as women declared the presence of disorders more often that men; (3) the precisely formulated disorders were reported more often than those for which the terminology was vague.
The three health scales included into the study—general health status, physical fatigue, mental fatigue—are rather different. When we considered the diseases most strongly associated with these scales among men and women, we observed that general health status was associated with the largest number of diseases (seven), physical (cardiac diseases, cerebrovascular accident, etc) as well as psychological (depression, nervous diseases). Physical fatigue was associated with only four diseases, both physical and psychological (sleep disorders, depression, anaemia, cancer), and mental fatigue with only three, all psychological (sleep disorders, depression, nervous disease). These results indicate the global and synthetic character of the general health status scale and the psychological specificity of the mental fatigue scale. In comparison, the physical fatigue scale is of less general interest.
A few diseases showed a strong association with the health scales; for example, for the general health status, of the 47 diseases studied among men, only six, all serious diseases (table 2A), had a coefficient above half a point: angina pectoris , myocardial infarction, cerebrovascular accident, depression, epilepsy and cancer. These strong associations, which were also observed in women when studied, were already partly described.7-10 The impact of the other self reported diseases, mostly less serious problems, on perceived health is generally low, which is in agreement with the hypothesis of global health being a combination of numerous health problems, more or less serious.
When a disease was reported two consecutive years, the impact on the scales differed according to the disease. For example, for the general health status among men (table 2A), the positive coefficients indicate a deterioration of health the second year for cancer and depression, but for epilepsy and myocardial infarction the coefficients are negative, thereby suggesting some improvement. This improvement, which was observed more often than deterioration, might be attributable either to a true improvement caused by treatment, or to an adaptation to the disease, which would reduce the perception of its consequences.
Finally, we must emphasise the simplicity and economy of the three health scales we used and their quality as a proxy for more specific data. General health status has already been studied4 6 21-23 to some degree. As far as we know, however, the relations of the two other scales with specific diseases have not previously been studied. Such an approach could be widely used in epidemiological contexts, where it is often difficult and expensive to obtain objective measures of health status.
Acknowledgments
The authors acknowledge the participation of the subjects of the Gazel cohort, EDF-GDF (French national gas and electric company).
References
Footnotes
-
Funding: the Gazel cohort is funded by grants from EDF-GDF (Electricité de France-Gaz de France) in association with INSERM (Institut National de la Santé et de la Recherche Médicale).
-
Conflicts of interest: none.