Health, employment, and economic change, 1973-2009: repeated cross sectional study
BMJ 2012; 344 doi: https://doi.org/10.1136/bmj.e2316 (Published 09 May 2012) Cite this as: BMJ 2012;344:e2316
- Jonathan William Minton, research associate1,
- Kate E Pickett, professor of epidemiology2,
- Danny Dorling, professor of human geography3
- 1University of Sheffield, School of Health and Related Research, Sheffield S1 4DA, UK
- 2University of York, Department of Health Sciences, Heslington YO20 5DD, UK
- 3University of Sheffield, Department of Geography, Sheffield S10 2TN
- Correspondence to: Jonathan William Minton j.minton{at}sheffield.ac.uk
- Accepted 1 March 2012
Abstract
Objective To see whether adverse relations between social class, health, and economic activity, observed between 1973 and 1993 and previously identified in a 1996 BMJ paper, were still apparent between 1994 and 2009 despite improvements in the general economic climate and overall population health.
Design Replication of repeated cross sectional analysis from the original paper, using the same source (the General Household Survey) and occupation coding scheme, but extended from the period 1973-93 to 1973-2009, and including women as well as men.
Subjects Men and women aged 20-59 years in each annual survey between 1973 and 2009.
Main outcome measures Change over time in class specific rates of employment, unemployment, and economic inactivity within subgroups of respondents.
Results Overall employment rates have decreased for men of working age while increasing for working age women. For men in particular, the gradient of these changes seems to depend on occupational group. Over 37 years, the differences in occupational group specific economic inactivity and employment rates between people reporting and those not reporting a limiting long term illness has increased substantially.
Conclusion Between 1973 and 2009, the relation between good health and securing and sustaining employment has strengthened for both men and women. For men, this has been due to employment rates decreasing and economic inactivity rates increasing among men with poor health. For women, this has largely been due to a general trend of increased employment and reduced economic inactivity occurring among healthier women but not in women of poorer health. Some evidence suggests that, since 2005, the relation between health, employment, and economic inactivity for women in the top two occupational groups has become more like that for men, with poor health becoming associated with reducing employment rates.
Introduction
This paper looks at how the relation between occupational background, ill health, and economic activity has changed over the period 1973 to 2009, following an approach described in a paper published in the BMJ in 1996.1 The research in the original paper was done to understand why falls in unemployment following the peaks of recessions in 1986 and 1990 were not accompanied by equal increases in employment. It found that job loss and economic inactivity related to ill health had a social gradient, with adverse employment consequences more likely for people in lower socioeconomic groups. The aim of this paper is to assess the long term consequences of the recessions of the 1980s and 1990s, and to look for early indications of the effect of the recession beginning in 2008.
Methods
The methods follow those described in the original paper. We used data from the General Household Surveys of Great Britain (incorporated as a module within the Integrated Household Survey and renamed the General Lifestyle Survey in 2008).
The General Household Surveys/General Lifestyle Surveys are annual surveys of households in Great Britain, which have been done by the Office for National Statistics (ONS) almost every year since 1971. Before 2005 it used a cross sectional design, and from 2005 onwards longitudinal components were incorporated so that some people were interviewed up to four years in succession. The surveys use a two stage, cluster randomised design. In stage one, postcodes are randomly selected using the postcode address file; in stage two, households within the postcode are selected. The number of households surveyed has varied each year and for most years has been in excess of 10 000. Annual response rates have varied between 67% and 85%, and in 2009 it was 73%.2 The ONS has not directly recorded demographic characteristics of non-responders, but differences between responders and non-responders have been indirectly assessed by comparison with the 2001 census.3
The original study used only men, aged between 20 and 59 years and excluding students and people on training schemes. In contrast, this paper will look separately at both men and women. Members of the population were assigned to one of four social classes on the basis of usual occupation, one of three labour market categories, and one of two health states. The social classes are class 1—professional/managerial; class 2—intermediate non-manual; class 3—skilled manual; and class 4—semi-skilled and unskilled manual. The labour market categories comprise three mutually exclusive and exhaustive states: employed, unemployed, and economically inactive. Both employment and unemployment are classed as forms of economic activity; unemployment differs from economic inactivity in that unemployed people remain part of the labour force through actively seeking work, whereas economically inactive people do not. The binary health state indicates whether the respondent reported a limiting long term illness. Although most of the surveys are cross sectional, and so do not allow tracking of the changing health and employment of individuals over time, they have the advantage of being done in a consistent way, using identical or near identical questions and classifications throughout the period.
Results
Figure 1⇓ shows employment levels for men in each occupational group, along with a dashed vertical line to indicate 1993, the final observation in the original paper. Figure 2⇓ shows the equivalent figures for women.


The general trend apparent by comparing figures 1⇑ and 2⇑ is that rates of employment have decreased for men but increased for women. For both men and women, rates of employment have tended to be higher among higher occupational groups, though the distinction seems to be more consistent for men than women. For men, a clear cyclic pattern in employment rates can be seen, corresponding to the recessions of the early 1980s and early 1990s; a clear decline is also evident in 2009. This cyclic pattern is less evident for women and is perhaps masked by the stronger long term trend towards higher employment rates.
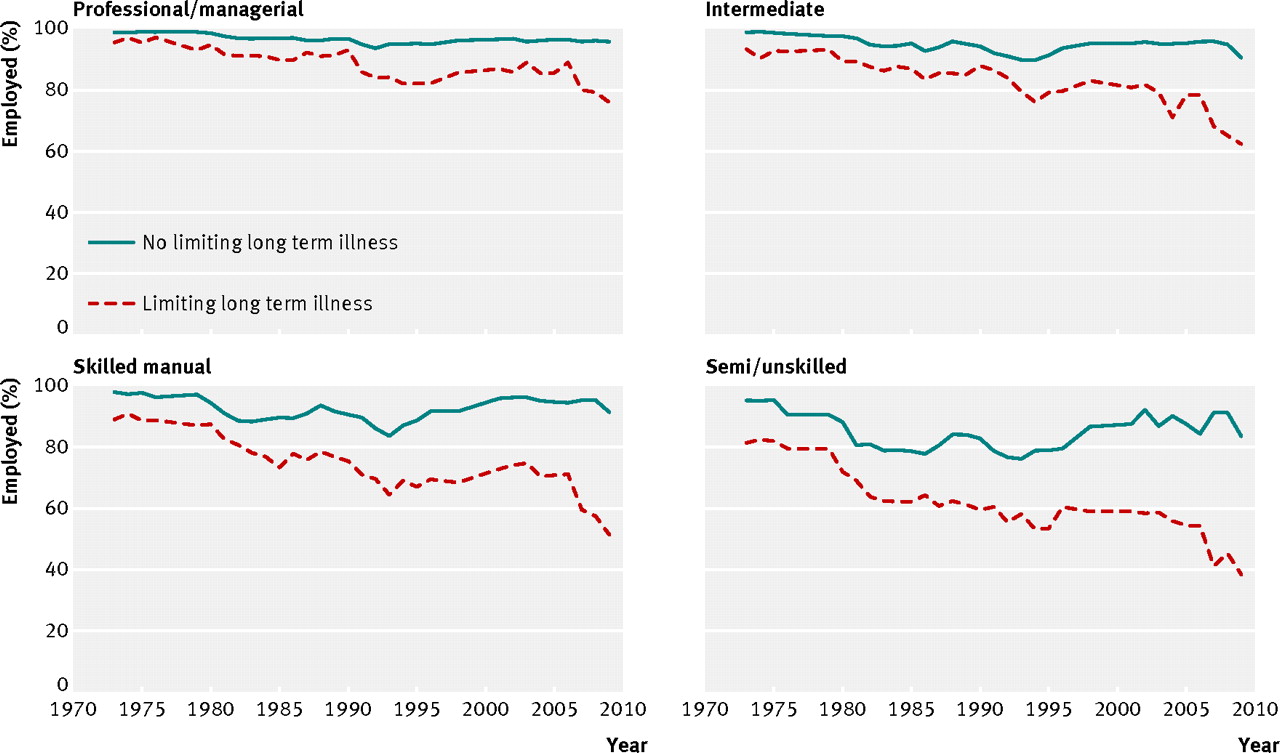
Figure 3⇓ shows employment rates for men, separately for those with and those without limiting long term illness, and for each of the four occupational groups. Figure 4⇓ shows the equivalent trends for women. Characterised crudely, rates of occupational group specific employment have declined only marginally for men without limiting long term illness and have declined significantly for those with such illness. Conversely, rates of occupational group specific employment have remained broadly constant for women with limiting long term illness and risen substantially for those without limiting illness. For both men and women, the employment deficit associated with limiting long term illness has increased substantially over time. For men in particular, occupational group seems to affect the disparity between those with and without limiting long term illness; “lower” occupational groups are associated with wider and more quickly increasing disparities. Figure 4⇓ indicates that employment rates have fallen for women with limiting long term illness in the two highest occupational categories since around 2005.

Fig 3 Employment rate in men of working age with and without limiting long term illness, by occupational group

Fig 4 Employment rate in women of working age with and without limiting long term illness, by occupational group
Figures 5⇓ and 6⇓ show what happened to rates of unemployment in men and women over the same time period. Occupational group specific rates have tended to be higher for men than women and both higher and more responsive to economic conditions for men of lower occupational groups. For all occupational groups and for both sexes, trends have not differed between those with and those without limiting long term illness.

Fig 5 Unemployment rate in men of working age with and without limiting long term illness, by occupational group

Fig 6 Unemployment rate in women of working age with and without limiting long term illness, by occupational group
Figure 7⇓ shows rates of occupational group specific economic inactivity for men with and without limiting long term illness. Figure 8⇓ shows the equivalent trends for women. The trend for men is clear: rates of occupational group specific economic inactivity have remained broadly constant for men without limiting long term illness but have increased substantially for each occupational group for men with limiting illness. The rate of the rise in economic inactivity among men with limiting long term illness is lowest for men in the highest occupational group and highest for those in the lowest occupational group. For women, rates of economic inactivity have decreased over the long term within each occupational group for those without limiting long term illness but have remained at relatively constant levels throughout for those with limiting illness. Mirroring trends seen in figure 4⇑, figure 8⇓ shows increases in inactivity rates for women with limiting long term illness in the highest two occupational groups but not in those without such illness.

Fig 7 Economic inactivity rate in men of working age with and without limiting long term illness, by occupational group

Fig 8 Economic inactivity rate in women of working age with and without limiting long term illness, by occupational group
The table⇓ shows the Pearson correlation between unemployment, employment, and economic inactivity for men and women in each occupational group and for those with and without limiting long term illness. For men, the presence or absence of a limiting illness seems to affect the relative strength of the occupational group specific correlation between employment and unemployment and between employment and economic inactivity: for those with limiting illness, employment and inactivity are very strongly negatively correlated, and employment and unemployment are only moderately negatively correlated. For those without limiting long term illness, by contrast, employment is strongly negatively correlated with unemployment and only weakly and inconsistently correlated with inactivity. For women, by contrast, employment is strongly negatively correlated with inactivity for both those with and those without limiting illness.
Pearson correlation between employment, unemployment, and economic inactivity for working age men and women, with and without limiting long term illness
Discussion
These analyses have shown a general long term trend towards reduced rates of occupational group specific employment among men of working age and a similar long term trend towards increased employment rates among women of working age. For both men and women, the employment gap between those with and without limiting long term illness has grown. For men this has mainly been due to employment rates being relatively stable for those without limiting long term illness while falling for those with such illness, whereas for women it has mainly resulted from relatively stable levels of employment among those with limiting illness and increased employment among those without such illness. For both men and women, occupational group seems to have a significant moderating effect on the effect of limiting long term illness on employment, unemployment, and inactivity rates, with greater and more rapidly widening deficits for people with limiting illness in lower occupational groups than in higher occupational groups.
Strengths and weaknesses of study
The main strength of this study is the long duration for which the General Household Survey/General Lifestyle Survey has been done, and the consistency with which the questions about health and occupation have been asked. This has allowed patterns in the relation between health and the labour market to be analysed over a time period of more than three decades. As a random sample of the population is selected for the survey each year, the results should remain representative of the UK population despite changes in its demography. As a subjective rather than objective assessment of participants’ health was used, we cannot identify whether objective standards of ill health have changed over time. More specific details on types of health complaint are limited.
Strengths and weaknesses in relation to other studies
The results presented here should be understood in the context of other research looking at different populations and sources of data. The effect of differences in culture and welfare systems is already recognised.4 5 6 Research has also used cohort studies,7 8 allowing causal relations to be scrutinised in greater depth and providing more specific and objective measurement of and information about health complaints.9 Research exists showing, for instance, that men and women have broadly similar rates of poorer health, although men tend to die earlier and more often at younger ages,10 that class gradients exist even in countries with more comprehensive and generous welfare systems such as Sweden,11 12 and that both acute and chronic health conditions have deleterious effects in the labour market.13 14 Existing research in general supports the conclusions presented here.
Meaning of study: possible explanations and implications for clinicians and policymakers
The substantive implications of being of working age and economically inactive have changed for both men and women over the long time period of this study. Historically, the default expectation for a man of working age has been to be either in or seeking employment. By contrast, this expectation of (formally defined) economic activity for working age women has not always been as strong owing to the historical expectation that the role of “homemaker” should be occupied by the woman of the household. The trends observed in this paper provide evidence of men and women becoming more alike in terms of engagement with the labour market. As this has happened, the effect of being in poor health on a person’s chances of being in employment has increased, widening the employment divide between those with and without limiting long term illness. On aggregate, the pattern of this widening health divide has been different for men and women. For men, it has been due to employment rates falling and economic inactivity rates increasing for those with limiting illness. For women, it has been due to employment rates not increasing and economic inactivity rates not falling among those with limiting long term illness, against a trend of increased employment and reduced economic inactivity among healthier women.
During periods of recession, people in poorer health are more likely to lose their jobs than are those in better health, as well as being more likely to have difficulty finding new jobs. Although their health may have been so poor as to make them eligible for incapacity benefit even when they were working, it was only once they lost their job that this latent ill health problem became realised as a (legitimate) claim for incapacity benefit, as they faced a choice between a lower rate as an unemployed person or a higher rate as an economically inactive person.15 16 17 After the replacement of invalidity benefit with incapacity benefit in 1995, the United Kingdom was recognised as having some of the toughest eligibility criteria for sickness based benefits in the developed world.18 When incapacity benefit was replaced by employment and support allowance in 2008, these criteria became tougher still, as personal capability assessment was replaced by the even more controversial work capability assessment.19 Employment and support allowance and before it the new Pathways to Work programme for new incapacity benefit claimants have represented a change in emphasis from what people with limited health cannot do to what would they could do.20 However, even slight disadvantages in terms of health can lead to large disadvantages in terms of employability during recessions, placing people at the back of a longer queue.
These findings have several implications for policy makers. They suggest that people with poor health face an increasing risk of leaving the labour market, and that re-entry may be difficult. Given this, ensuring that working people in poor and worsening health are supported to remain working where they wish to and where it is appropriate to do so seems important. The onus for making “reasonable adjustments” to a workplace, as well as financial liability for making such changes, is on the employer. Financial support for making such changes may make it easier for employers to support workers in poorer health without jeopardising their economic viability. Appropriate support and similar “demand side” interventions may also encourage potential employers to give greater consideration to candidates with poorer health, reducing the employment disadvantage they encounter and balancing the predominantly “supply side” policy changes introduced in recent years to reduce the claimant population for incapacity benefit and employment and support allowance.21 “Cutting red tape” and making it easier to initiate redundancy should be expected to further exacerbate the adverse trends identified here.
Given the nature of manual labour, making accommodations to the demands of the work may be more difficult for people in poorer physical health in manual work compared with non-manual work, so poor health may make these kinds of work activity particularly hard. However, differences seem to exist between nations in terms of the extent to which the effect of chronic illness on employment and economic inactivity is class differentiated, suggesting that labour market policies can have a considerable effect on these trends.22 Ensuring that sufficient opportunities exist for retraining manual workers with poor health with the skills necessary for non-manual work seems important for ensuring that poor health does not lead to workers falling out of the labour market completely. Given that these results suggest that more than half of male unskilled and semi-skilled manual workers with poor health are economically inactive, an urgent need seems to exist for improvements in this area. Given the highly politicised nature of this area of health management, clinicians have a vital role in ensuring that the health needs of people reporting poor health are recognised and met, and that both the theory and practice of welfare to work initiatives for this patient group are conducive to improving health and wellbeing.
Unanswered questions and further research
Of course, further questions remain—in particular, how the current recession will compare with the previous recessions in the 1930s, 1970s, 1980s, and 1990s. To answer this consistently will require that the General Household Survey/General Lifestyle Survey remains in existence and in a sufficiently similar format to allow comparability with previous editions, allowing this research to be updated again in five or 10 years. Unfortunately, in 2011 the ONS announced that the General Lifestyle Survey will be discontinued after January 2012,23 so the 2010 and 2011 releases of the dataset will be the final opportunities for updating this analysis. Even these data could allow further avenues for research, such as research exploring the influence of age on the patterns seen in this paper. In addition to further research using panel surveys along the lines mentioned previously and doing systematic reviews to effectively summarise the existing evidence, exploring such matters using a survey with more than three decades of observations should make a major contribution to our understanding of long term trends in work and public health. By allowing us to take the long view, this research provides evidence that can help to inform our understanding of some of the evidence used and misused in contemporary debates about incapacity benefits and welfare reform.24
What is already known on this topic
People of working age with limiting long term illness have higher rates of economic inactivity and lower rates of employment than do working age people without such illness
What this study adds
The gap in employment opportunities between people with and without limiting long term illness has grown substantially since 1973
Notes
Cite this as: BMJ 2012;340:e2316
Footnotes
Contributors: JM had the idea for the research, did the statistical analysis, and wrote the initial draft. DD and KEP contributed to the analysis plan, interpretation of data, and all revisions of the manuscript. JM is the guarantor.
Funding: None.
Competing interests: All authors have completed the Unified Competing Interest form at http://www.icmje.org/coi_disclosure.pdf (available on request from the corresponding author) and declare: no support from any organisation for the submitted work; no financial relationships with any organisations that might have an interest in the submitted work in the previous three years; no other relationships or activities that could appear to have influenced the submitted work.
Ethical approval: Not needed.
Data sharing: Further summary data and the R script developed to analyse the data are available from the corresponding author at j.minton{at}sheffield.ac.uk. The surveys used remain property of the Office for National Statistics.
This is an open-access article distributed under the terms of the Creative Commons Attribution Non-commercial License, which permits use, distribution, and reproduction in any medium, provided the original work is properly cited, the use is non commercial and is otherwise in compliance with the license. See: http://creativecommons.org/licenses/by-nc/2.0/ and http://creativecommons.org/licenses/by-nc/2.0/legalcode.