Article Text

Abstract
Objectives The risk of diabetes mellitus may be elevated among persons exposed to some pesticides, including cholinesterase-inhibiting insecticides (organophosphates and carbamates). The objective of this study was to investigate how acetylcholinesterase activity was associated with mean blood glucose levels among smallholder farmers in Uganda.
Methods We conducted a short-term follow-up study among 364 smallholder farmers in Uganda. Participants were examined three times from September 2018 to February 2019. At each visit, we measured glycosylated haemoglobin A (HbA1c) as a measure of long-term average blood glucose levels. Exposure to organophosphate and carbamate insecticides was quantified using erythrocyte acetylcholinesterase normalised by haemoglobin (AChE/Hb). For a subgroup of participants, fasting plasma glucose (FPG) was also available. We analysed HbA1c and FPG versus AChE/Hb in linear mixed and fixed effect models adjusting for age, sex, physical activity level, and consumption of fruits and vegetables, alcohol and tobacco.
Results Contrary to our hypothesis, our mixed effect models showed significant correlation between low AChE/Hb and low HbA1c. Adjusted mean HbA1c was 0.74 (95% CI 0.17 to 1.31) mmol/mol lower for subjects with AChE/Hb=24.3 U/g (35th percentile) compared with subjects with AChE/Hb=25.8 U/g (50th percentile). Similar results were demonstrated for FPG. Fixed effect models showed less clear correlations for between-phase changes in AChE/Hb and HbA1c.
Conclusions Our results do not clearly support a causal link between exposure to cholinesterase-inhibiting insecticides and elevated blood glucose levels (expressed as HbA1c and FPG), but results should be interpreted with caution due to the risk of reverse causality.
- epidemiology
- diabetes mellitus
- agriculture
- developing countries
- pesticides
This is an open access article distributed in accordance with the Creative Commons Attribution Non Commercial (CC BY-NC 4.0) license, which permits others to distribute, remix, adapt, build upon this work non-commercially, and license their derivative works on different terms, provided the original work is properly cited, appropriate credit is given, any changes made indicated, and the use is non-commercial. See: http://creativecommons.org/licenses/by-nc/4.0/.
Statistics from Altmetric.com
Key messages
What is already known about this subject?
A number of studies have suggested that exposure to cholinesterase inhibiting insecticides is associated with increased risk of diabetes mellitus, but the evidence is limited by cross-sectional designs and poor confounder control.
What are the new findings?
Contrary to our hypothesis, our follow-up study with good confounder control showed a significant correlation between lower erythrocyte cholinesterase and lower glycated haemoglobin A.
Similar patterns were seen for fasting plasma glucose.
How might this impact on policy or clinical practice in the foreseeable future?
Our findings do not seem to support a causal link between cholinesterase inhibiting insecticides and diabetes mellitus, but both exposure and outcome of interest were indirectly assessed, so caution is warranted when interpreting results.
Future studies on the relationship between cholinesterase inhibitors and diabetes mellitus should combine acetylcholinesterase with other objective exposure metrics and validated subjective exposure information.
Introduction
Diabetes mellitus (DM) is a heterogeneous group of diseases characterised by insulin resistance and/or decreased insulin production,1 with a global prevalence of 8.5%.2 While some risk factors for DM are well known (eg, human leucocyte antigen genotype for type 1 DM, and physical inactivity and overweight for type 2 DM), possible novel risk factors for DM include pesticide exposure. A 2016 meta-analysis found an overall OR of 1.58 (95% CI 1.32 to 1.90) of DM for highest versus lowest tertile of exposure to any pesticide, but most studies considered only exposure to organochlorine insecticides such as dichloro-diphenyl-trichloroethane.3 Less is known for other insecticides that are more widely used in modern agriculture, and most earlier studies are cross-sectional and use crude exposure metrics, making them sensitive to bias. Given their diverse toxicodynamic modes of action,4 results from one class of pesticides cannot be extrapolated to other classes. Organophosphate insecticides have been suggested to increase the risk of DM by perturbing gluconeogenesis and glycogenolysis, and by leading to insulin resistance through oxidative stress and pro-inflammatory effects.5 Due to the burden of morbidity and mortality from DM2 and the widespread use of pesticides,6 even modest risk increases could be relevant at population level.
The absolute amounts of pesticide used in sub-Saharan Africa are relatively low compared with other regions,7 but farmers may be highly exposed due to unsafe pesticide handling practices. A 2014 study in the Wakiso District in Uganda showed that 94% of smallholder farmers used pesticides, organophosphate insecticides were some of the most common and 70% of farmers applied pesticides while wearing their regular clothes.8 The overall prevalence of DM in Uganda is 2.7%.9 To the best of our knowledge, no previous study has focused on hyperglycaemic among Ugandan farmers. The purpose of this study was to investigate how objectively quantified exposure to cholinesterase inhibiting insecticides was related to average blood glucose levels in a cohort of smallholder farmers in the Wakiso District.
Methods
Study design
In a short-term follow-up study among smallholder farmers from the Wakiso District in central Uganda, we collected information on both exposure and outcome at baseline in September–October 2018, and at two follow-up examinations in November–December 2018 and January–February 2019. Participants were recruited from an organisation of conventional farmers and an organisation of farmers working towards organic certification of some crops. The timing and method of recruitment was intended to maximise exposure variation within and between persons, as we had been informed that the main insecticide application season in the area was October–November (personal communication, Aggrey Atuhaire, Uganda National Association of Community and Occupational Health).
Participant recruitment
We attended the weekly meetings of farmers’ groups from the two organisations and invited all members, excluding pregnant women and farmers under 18 years. The list of eligible individuals was randomised using a pseudo-random number generator. Potential participants were then invited to the examination centre in sequence. If potential participants could not be reached by phone, or were unable to come, the next person on the list was approached.
Figure 1 provides an overview of participant recruitment and exclusion. Out of 532 persons recruited at the meetings, 380 came to the examination centre, and 364 participated at baseline. There was only negligible loss to follow-up: 356 and 354 persons participated in phase II and III, respectively.
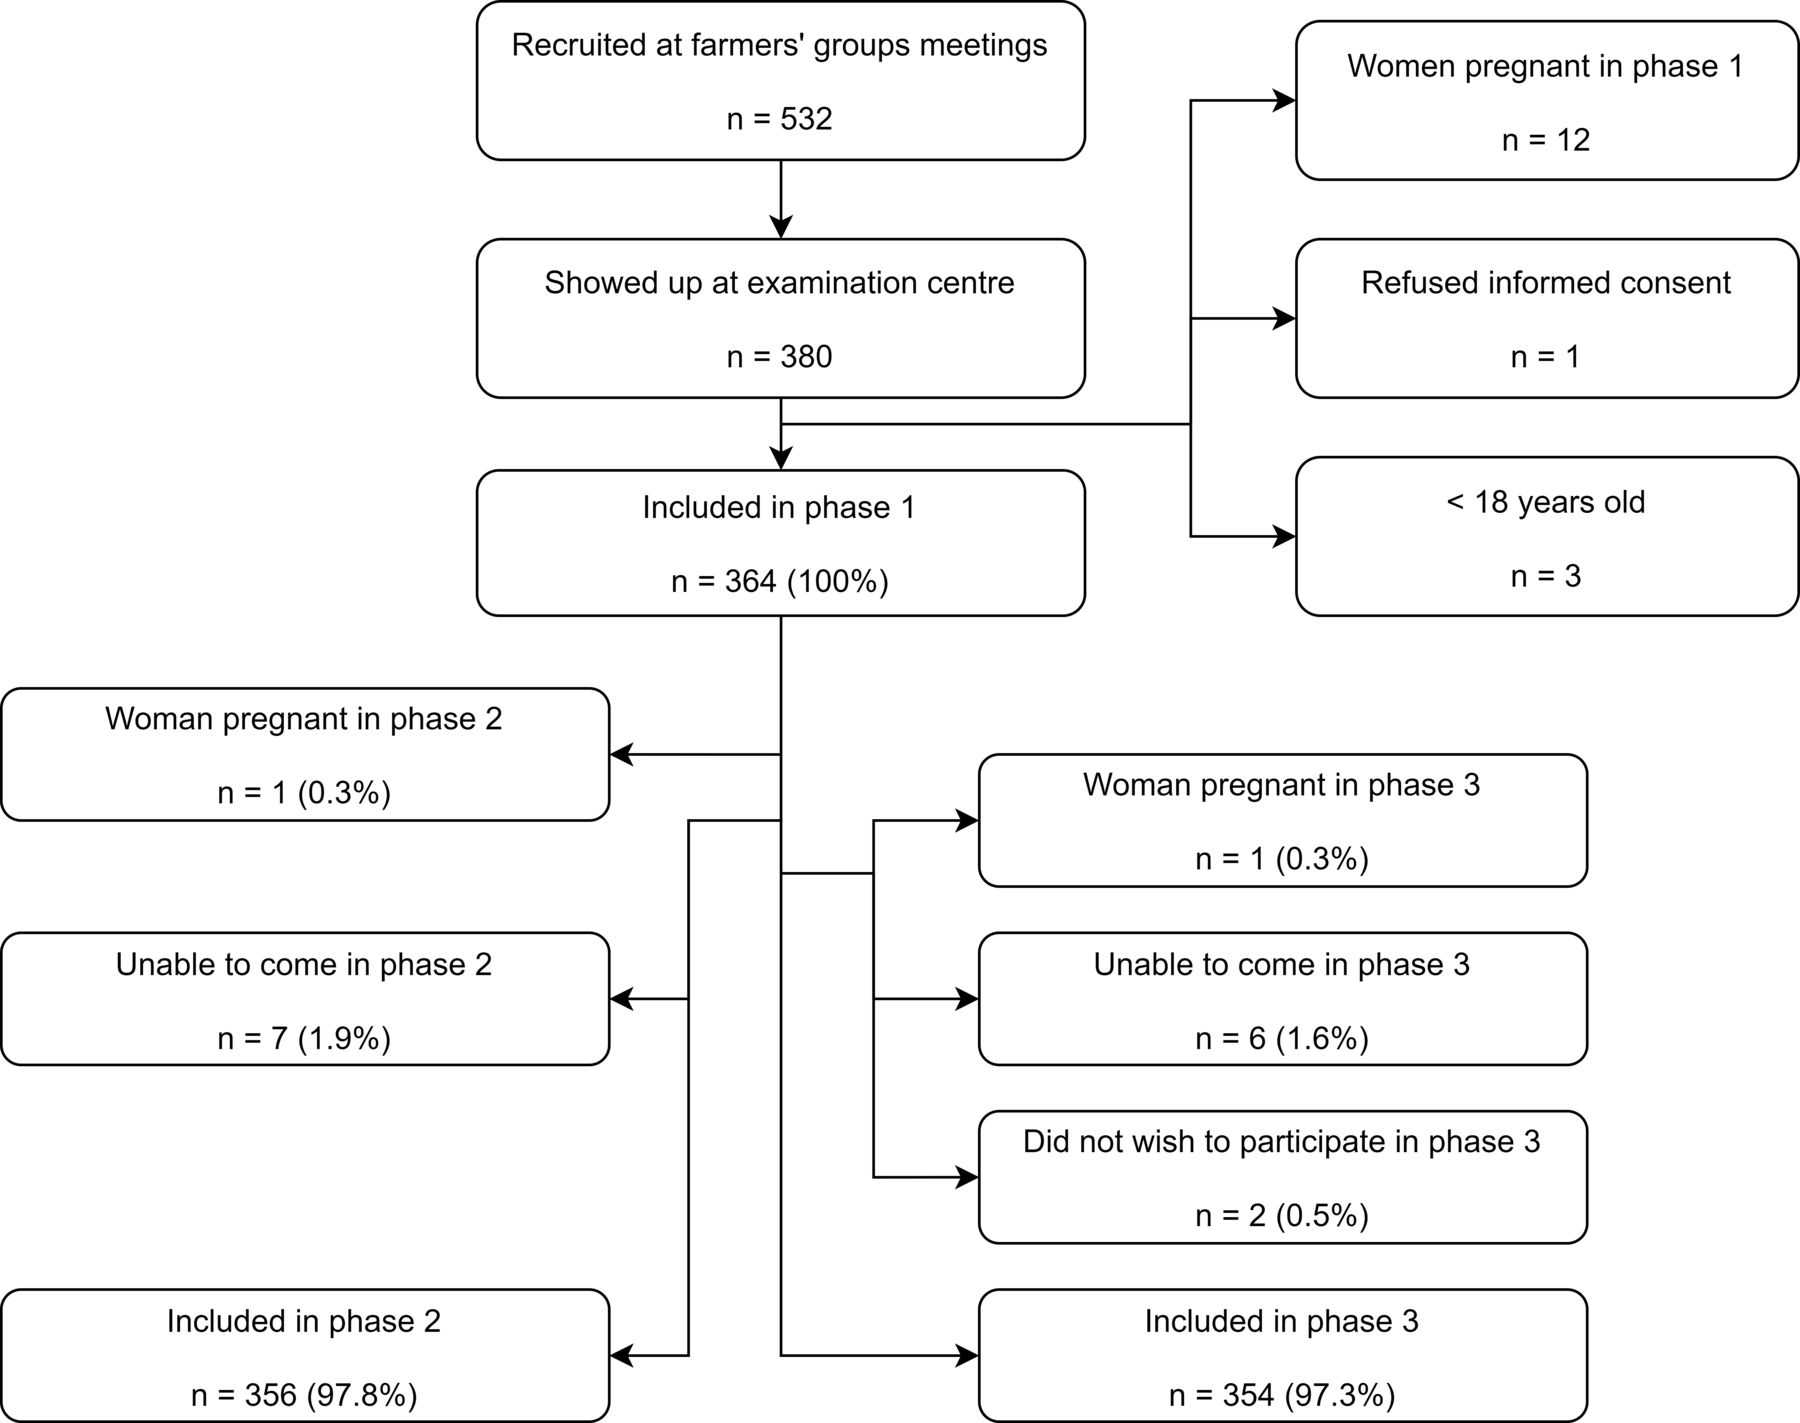
Flow chart of participant recruitment.
Outcome assessment
Our main outcome was glycosylated haemoglobin A (HbA1c), a measure of the average blood glucose levels for the last 8–12 weeks.10 Potassium EDTA venous blood was analysed for HbA1c at the examination centre using the HemoCue HbA1c 501 system (HemoCue, Ängelholm, Sweden) according to the manufacturer’s instructions.11 More than 90% of samples were analysed for HbA1c within 2 hours.
As a secondary outcome, participants who came to the examination in the morning after a 12-hour fast were also tested for capillary blood fasting plasma glucose (FPG) using the HemoCue Glucose 201 RT (HemoCue). FPG was analysed immediately after sampling. Because of logistic constraints, participants were not randomised for FPG testing; we tested participants who were able and willing to come fasting in the morning.
The device used to measure HBA1c had a lower limit of quantitation (LOQ) of 4% NGSP=20 mmol/mol. All results <LOQ (n=35, 3.2%) were assigned the value of 3.71% NGSP=16.8 mmol/mol, based on the assumed distribution density of HbA1c (see online supplementary appendix 1).
Supplemental material
Exposure assessment
Exposure to organophosphate and carbamate insecticides was quantified by analysis of capillary blood erythrocyte acetylcholinesterase (AChE). The primary toxicodynamic target of organophosphate and carbamate insecticides is nervous system acetylcholinesterase.12 Measurements of the erythrocyte isoenzyme can be used to express exposure.13 Analysis was performed immediately after sampling, using the Test-Mate ChE Cholinesterase Test System Model 400 (EQM Research, Cincinnati, Ohio, USA) according to the manufacturer’s instructions.14 The device automatically normalised the AChE by the Hb, resulting in our primary exposure metric, AChE/Hb.
Biochemical results were manually recorded, and later double entered into the Open Data Kit (ODK) Collect app.15 Extensive quality control of the biochemical analyses was performed; results have been reported elsewhere.16
Confounder selection and assessment
Potential confounders were selected a priori based on Directed Acyclic Graphs.17 The basic set of confounders comprised sex, age, physical activity level (metabolic equivalent task minutes in the last week) and current consumption of alcohol (g/week), tobacco (g/day) and fruits and vegetables (servings per day in the last week). An extended set of confounders also included years of full-time education (proxy for socioeconomic status) and Body Mass Index (BMI). Subjective information on confounders was collected using the WHO STEPS18 and Global Physical Activity Questionnaire (GPAQ).19 Subjective pesticide exposure information was provided from a modified version of a questionnaire designed to capture exposure among smallholder farmers in low-income and middle-income countries.20 21 Subjects were interviewed in Luganda or English, depending on their own language preferences. Answers were digitised immediately using ODK Collect.15
Weight was measured in a standardised manner22 with the participant wearing only light clothes, using a medical scale (seca robusta 813, seca, Hamburg, Germany). Height was measured in a standardised manner22 using a stadiometer (SM-SZ-300, Sumbow Medical Instruments, Ningbo, China). Anthropometric data were digitised immediately using ODK Collect.15
Statistical analyses
Since DM can be considered the extreme end of a spectrum of hyperglycaemic,1 we analysed HbA1c and FPG as continuous variables. To account for family relationships and repeated measurements, data were analysed in a linear mixed effect model with fixed effects for the exposure and confounder variables and random effects for family and participant. The regression coefficient for the exposure variable was allowed to vary randomly between participants. The model can be written as:

where y is the outcome, and  is the intercept;
  is the regression coefficient for the effect of the exposure b on y;
  is normally distributed, and each person has their own value of
  ;
;  is the regression coefficient for the effect of the ith confounder
  on y. All participants have the same value of
  . The random effects for families and persons are α and τ, and ε is an error term. All three measurements for each participant are included in the same regression model.
In secondary analyses, we analysed our results in a fixed effect model focusing on changes within persons from one phase to another, in order to remove the effect of unmeasured time-invariant confounders. The model can be written as

where  is the change in the outcome between two phases, and
  is the change in the ith independent variable
  between the phases. All participants have the same regression coefficient
  . The random effect for family is α, and ε is an error term.
Python 3 (Python Software Foundation, https://www.python.org/) and Stata 15 (StataCorp, College Station, Texas, USA) were used for data management, while data were analysed in Stata 15. Sex was entered as a categorical variable; all other independent variables were continuous and were generally modelled using restricted cubic splines with four knots to allow non-linear exposure-response relationships. However, effects of alcohol and tobacco consumption were assumed linear, as the low numbers of persons smoking or drinking alcohol did not allow the use of splines (table 1). Spline analysis results were plotted using xblc.23 We included participants who had at least one study visit with no missing values for any of the included variables. As the loss to follow-up was very low, we did not adjust for it statistically. Sensitivity analyses were conducted to test the robustness of our findings; online supplementary appendix 2 describes all analyses and results. Analyses were prespecified in a published analysis protocol,17 and deviations from protocol are also listed in online supplementary appendix 2.
Supplemental material
Demographic and anthropometric data at baseline
To aid in the interpretation of the findings, we conducted analyses of variance for all biochemical metrics. For each metric (eg, HbA1c), we fitted a linear mixed effect model that had no fixed effect terms, but included random effect terms for family and participant. Results are shown in online supplementary appendix 5.
Supplemental material
Results
Demographic data at baseline are presented in table 1, both overall and stratified by AChE/Hb below/above the median (26.3 U/g). The purpose of the stratification is to check for imbalances in demographic variables that might introduce confounding. The potential confounders were almost equally distributed between the two AChE/Hb strata apart from sex, where AChE/Hb seems higher for men than for women (table 1). Physical activity levels were very high; the median number of MET-minutes per week was 11 240, corresponding to 23.4 hours of vigorous or 46.8 hours of moderate activity per week,19 reflecting the degree of manual labour in Ugandan smallholder agriculture. Somewhat surprisingly, the use of pesticides, including cholinesterase inhibitor insecticides, was similar in the two AChE/Hb strata. Self-reported pesticide exposure information is available in online supplementary appendix 3, while online supplementary appendix 4 lists the use of personal protective equipment (PPE) during handling of pesticides. Almost all the cholinesterase inhibitor insecticide used by study participants were organophosphates—carbamates were seldom used. The use of PPE was very low, and gumboots was the only type of PPE used by >50% of directly exposed persons.
Supplemental material
Supplemental material
A significant negative trend in AChE/Hb across project phases was seen, with a mean change per phase −0.74 (95% CI −0.85 to −0.63) U/g (table 2). A positive trend in HbA1c was evident, with a mean change per phase 0.41 (95% CI −0.03 to 0.85). For FPG, no evident trend was seen.
Descriptive statistics for glycaemic regulation and AChE/Hb across project phases
Exposure and outcome variables showed considerable within-person variance (online supplementary appendix 5): for log-transformed HbA1c, the ratio between within-person variance and the sum of between-family and between-person variance was 0.74, while the ratio was 1.28 and 0.22 for log-transformed FPG and for AChE/Hb, respectively.
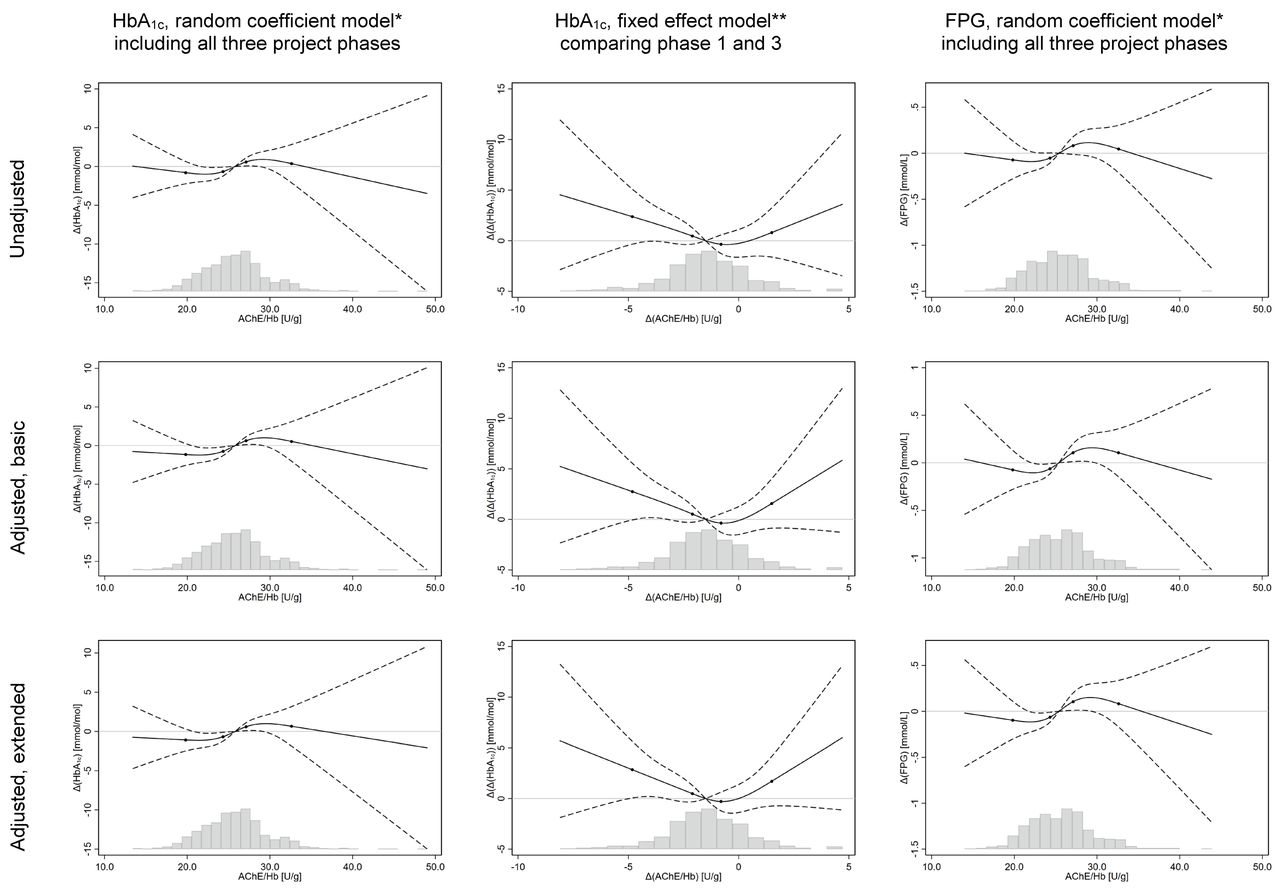
In both unadjusted and adjusted analyses, a significant association was demonstrated between low AChE/Hb and low HbA1c (figure 2). The reference is the median (50th percentile) of AChE/Hb values in each model. In the basic adjusted model, mean HbA1c was 0.74 (95% CI 0.17 to 1.31) mmol/mol lower for subjects with AChE/Hb=24.3 U/g (35th percentile) than for reference subjects with AChE=25.8 U/g (50th percentile). Furthermore, subjects with AChE/Hb=27.1 (65th percentile) had mean HbA1c 0.63 (95% CI 0.12 to 1.14) mmol/mol higher than the reference. FPG was also lower for subjects with low AChE/Hb in both unadjusted and adjusted analysis (figure 2). In the basic adjusted model, mean FPG was 0.06 (0.01; 0.12) mmol/L lower for subjects with AChE/Hb=24.3 U/g (35th percentile) than for reference subjects with AChE/Hb=25.4 mmol/L (50th percentile), and 0.11 (95% CI 0.01 to 0.20) mmol/L higher for subjects with AChE/Hb=27.1 U/g (65th percentile). To put these numbers in context, the same models showed that mean HbA1c was 5.98 mmol/mol higher for subjects aged 68.7 years(95th percentile) compared with subjects aged 23.2 years (5th percentile), and mean FPG was 0.47 mmol/L higher.

Results from analyses of glycaemic regulation versus AChE/Hb, modelled using splines. *Basic set of confounders=age, sex, alcohol consumption in last week, tobacco consumption in the last week, MET-minutes of physical activity in the last week, servings of fruits and vegetables consumed per day in the last week. Extended set=basic set+Body Mass Index and years of full-time education. **Basic set of confounders=Δ(age), Δ(alcohol consumption), Δ(physical activity), Δ(consumption of fruits and vegetables) and Δ(tobacco consumption). Extended set=basic set+Δ(body mass index). Y-axis=difference in outcome, relative to the predicted value at the median value of the independent variable. Solid black line=estimate, modelled using restricted cubic splines with four knots. Dashed black lines=95% CI. Black dots on trend line show the location of the spline knots. Histogram shows the distribution of the independent variable for observations in the model.
Results from sensitivity analyses are provided in online supplementary appendix 2, and they showed that our findings were robust to different modelling strategies. The most important sensitivity analyses are described in the following paragraphs.
Due to incomplete data for family relationships, in one sensitivity analysis we derived CIs using a bootstrap procedure, in addition to the random effect for family. Results from this analysis were similar to the main analysis, and remained statistically significant.
Further adjusting for Hb concentration did not change our results, nor did adjusting for project phase. We also dichotomised HbA1c into normal (≤38 mmol/mol) or elevated (≥39 mmol/mol),1 and analysed the dichotomous variable in a mixed effect logistic regression model. Lower AChE/Hb was significantly associated with lower odds of having HbA1c ≥ 39 mmol/mol, supporting the main findings.
Finally, in the fixed effect model of change in AChE/Hb versus change in HbA1c within individuals from phase I to III, decreased AChE/Hb seemed associated with increased HbA1c in both the unadjusted and adjusted analysis (figure 2). The association was less clear in sensitivity analyses comparing phase I/II or II/III (online supplementary appendix 2).
Discussion
We expected low activity (as a marker of exposure to organophosphate and carbamate insecticides) to be associated with increased blood glucose levels. However, our main analyses showed significant associations between low AChE/Hb and low HbA1c, as well as low FPG. Sensitivity analyses gave similar results, strengthening confidence in the findings. On the other hand, results from fixed effect models focusing on changes within individuals were inconsistent and showed no clear correlations between changes in AChE/Hb and changes in HbA1c.
Previous studies on the association between cholinesterase inhibiting insecticides and DM are inconsistent. Shapiro et al conducted a follow-up study among pregnant Canadian women environmentally exposed to organophosphates, finding that high urinary levels of organophosphate metabolites were correlated with decreased odds of being diagnosed with either gestational diabetes or gestational impaired glucose tolerance.24 On the other hand, a cross-sectional study in the general US population showed no associations between FPG, HOMA-IR (Homeostatic Model Assessment for Insulin Resistance) or HbA1c versus urinary organophosphate metabolites.25 Among Indian farmers and villagers, there was no significant difference in butyryl cholinesterase (BChE) between subjects with diabetes and without diabetes, but odds of DM was significantly positively correlated with plasma levels of some organophosphates.26 Finally, in a follow-up study among greenhouse workers in Spain, workers had significantly higher FPG in a high-exposure than in a low-exposure period, and both AChE/Hb and BChE decreased in the high-exposure period. While our results are in line with those of Shapiro et al,24 both of the last two studies seem to contradict them. Shapiro et al suggested that the negative correlation in their study might be due to confounding from intake of fruit and vegetables with pesticide residues.27 In our population this is an unlikely explanation, as the consumption of fruit and vegetables was generally very low (table 1), and was included as an independent variable in our models. Differences in exposure metrics and study populations might explain the conflicting results, but it is difficult to draw any clear conclusions regarding the relationship between exposure to organophosphate and carbamate insecticides and the risk of DM.
The main strength of this study is the repeated measurement design with negligible loss to follow-up and three phases of objective measurements of both exposure and outcome for all participants. Confounders were selected a priori based on Directed Acyclic Graphs, and information on confounders was collected using the standardised WHO STEPS18 and GPAQ19 instruments. A previous version of GPAQ had moderate validity in Ethiopia, with Spearman’s rho=0.31 for self-reported versus pedometer-measured physical activity time.28 The mean consumption of fruits and vegetables in our study are in line with a previous study in Uganda, which showed that only 12.2% of subjects consumed five or more servings of fruit and vegetables per day in a ‘typical’ week.29
Demographic variables were similar between individuals with low and high AChE/Hb, making it less plausible that other variables co-vary enough with AChE/Hb to be responsible for the demonstrated associations. Theoretically, the relationship between AChE/Hb and HbA1c could be biassed if both HbA1c and AChE/Hb were affected by Hb levels. The direction of such bias is difficult to predict, as different types of anaemia affect erythrocyte lifespan differently.30 However, the relationship between AChE/Hb and HbA1c was unchanged in a sensitivity analysis including Hb level as a covariate, so confounding from anaemia does not explain our findings. We considered whether the associations between AChE/Hb, HbA1c and FPG could be due to changed toxicokinetics in overweight individuals. Between-person differences and within-person changes in body fat might influence the excretion of organophosphates, since most are lipophilic.31 However, that does not explain our results, as associations persisted after adjustment for BMI.
Our study also has some important limitations. Our sampling strategy was convenience-based rather than random, which could lead to selection bias. However, to explain our findings, the selection should have made participants most likely to participate if they were highly exposed and had low HbA1c, or if they had low exposure and high HbA1c. We find such selection unlikely. For logistic reasons, HbA1c was assessed using a point-of-care device, which might not have the same level of precision and accuracy as what could be provided by a clinical biochemical lab. According to the manufacturer, the HemoCue HbA1c 501 system is ‘interference-free, which means it is unaffected by Hb variants’,32 but a recent study found that results were somewhat negatively biassed for blood samples with sickle cell trait (ie, heterozygous for haemoglobin S (HbS)).33 We did not measure variant Hb, but the proportion of participants with HbS is likely considerable, as a recent study among children of HIV-positive mothers in the same region found that 12.8% of infants had HbS.34 Interference from variant Hb could bias our dose-response relationships away from the null if it also affected AChE/Hb activity. However, while patients with sickle cell anaemia have considerably higher AChE/Hb than healthy controls, healthy persons with sickle cell trait only have normal AChE/Hb.35 Hence, interference from variant Hb is unlikely to explain our results, and it cannot explain why we see the same association between AChE/Hb and FPG. In a study in South Africa, the HemoCue HbA1c 501 had an area under the curve of 0.81 for diagnosis of DM,36 indicating that results are imprecise. However, imprecision leads to bias towards the null and cannot explain the associations either.
AChE/Hb is a well-established biomarker of exposure to organophosphate and carbamate insecticides,13 and all analyses presented in this paper used AChE/Hb as an objective exposure metric. Due to poor correlation between self-reported spraying activities and AChE/Hb (table 1), we did not perform analyses based on subjective exposure information. Hence, effect estimates for AChE/Hb might be biased by the use of other classes of pesticides. The lack of a correlation between subjective spraying information and AChE/Hb might be due to substantial exposure through other routes than spraying (eg, re-entry work in sprayed fields and pest control operations in subjects’ homes), recall bias or recovery of AChE activity in the time between exposure and interview. Alternatively, it could be an indication that AChE/Hb is a suboptimal exposure metric in the study population. AChE can be influenced by many physiological and pathological conditions,37 including blood sugar levels. For example, patients with dysregulated type 1 diabetes have been shown to have lower AChE activity than both healthy controls and well-controlled type 1 diabetics.38 It is therefore possible that the exposure-response relationships are affected by unknown factors influencing both glucose levels and AChE, or due to reverse causality.
Due to interindividual variability in AChE/Hb, it is recommended that when using AChE/Hb to monitor insecticide exposure, each person’s results should be compared with their own pre-exposure levels, instead of using population reference values.39 However, we could not clearly define a ‘pre-exposure’ period for the study population, as subjectively reported pesticide use was similar in the three project phases (online supplementary appendix 3). We do not think that this is a problem for our analyses, as our models explicitly account for both within-individual and between-individual variability in AChE/Hb.
The possibility of bidirectional links between AChE/Hb and glycaemic regulation challenges the use of AChE/Hb as exposure metric for this particular outcome. Alternative objective exposure metrics such as hair or urine levels of organophosphate metabolites, or measurements of subjects’ exposures using personal samplers, might be better suited due to a smaller risk of bias. During the data collection phase of the PEXADU project, participants wore passive pesticide samplers in the form of silicone wristbands, and a random subsample gave urine samples. The future analysis of these samples should be able to shed more light on the causal relationships between blood glucose levels and exposure to cholinesterase-inhibiting pesticides, which has potential important implications for both workers and the general population.
Conclusion
Contrary to our hypothesis, we found a correlation between low Hb-adjusted acetylcholinesterase activity (AChE/Hb), low HbA1c and low FPG. The relationship between change in AChE/Hb and change in HbA1c between project phases was less clear. Our study does not clearly support a causal link between exposure to organophosphate and carbamate insecticides and elevated blood glucose levels (expressed as HbA1c and FPG).
Acknowledgments
The authors would like to thank the Uganda National Association of Community and Occupational Health, Caritas Uganda, Wakiso District Farmers Association, the Agency for Integrated Rural Development and the Diálogos Foundation for their help. The authors would also like to thank all the participants of the study, and the data collection team.
References
Footnotes
Contributors MRHH: conceptualisation; methodology; formal analysis; investigation; data curation; writing—original draft; project administration; funding acquisition. EJ: conceptualisation; methodology; writing—review and editing; supervision. AS: conceptualisation; methodology; writing—review and editing; supervision. DS: conceptualisation; methodology; resources; writing—review and editing. JCS: conceptualisation; methodology; writing—review and editing. RM: conceptualisation; methodology; writing—review and editing. PS: conceptualisation; methodology; writing—review and editing. SF: conceptualisation; methodology; writing—review and editing. AB: methodology; writing—review and editing. BMB: methodology; writing—review and editing. VS: conceptualisation; methodology; writing—review and editing; supervision; funding acquisition. All authors have reviewed and approved the final manuscript.
Funding The PEXADU project was supported by the Aarhus University Research foundation (project number 81231) and the National Research Centre for the Working Environment (project number 10322).
Disclaimer The funding bodies played no role in study design, data collection, data analysis, drafting of the manuscript or the decision to publish.
Competing interests None declared.
Patient consent for publication Not required.
Ethics approval The study was conducted in accordance with the Helsinki Declaration and reported following the guidelines in the Strengthening the Reporting of Observational Studies in Epidemiology statement. All participants gave informed consent prior to inclusion and were financially compensated for lost earnings on examination days. The project was approved by the Uganda National Council for Science and Technology (registration number HS234ES) and the Higher Degrees Research and Ethics Committee at Makerere University School of Public Health (MakSPH-HDREC, registration number 577).
Provenance and peer review Not commissioned; externally peer reviewed.
Data availability statement Data are available on reasonable request. For access to deidentified data from the subset of participants who have consented to data sharing, please contact the corresponding author (ph@au.dk). Access requires permission from the MakSPH-HDREC and the Danish Data Protection Agency.