Article Text

Abstract
Objectives Lack of physical activity (PA) has been hypothesised as an underlying mechanism in the adverse health effects of shift work. Therefore, our aim was to compare non-occupational PA levels between shift workers and non-shift workers. Furthermore, exposure–response relationships for frequency of night shifts and years of shift work regarding non-occupational PA levels were studied.
Methods Data of 5980 non-shift workers and 532 shift workers from the European Prospective Investigation into Cancer and Nutrition-Netherlands (EPIC-NL) were used in these cross-sectional analyses. Time spent (hours/week) in different PA types (walking/cycling/exercise/chores) and intensities (moderate/vigorous) were calculated based on self-reported PA. Furthermore, sports were operationalised as: playing sports (no/yes), individual versus non-individual sports, and non-vigorous-intensity versus vigorous-intensity sports. PA levels were compared between shift workers and non-shift workers using Generalized Estimating Equations and logistic regression.
Results Shift workers reported spending more time walking than non-shift workers (B=2.3 (95% CI 1.2 to 3.4)), but shift work was not associated with other PA types and any of the sports activities. Shift workers who worked 1–4 night shifts/month (B=2.4 (95% CI 0.6 to 4.3)) and ≥5 night shifts/month (B=3.7 (95% CI 1.8 to 5.6)) spent more time walking than non-shift workers. No exposure–response relationships were found between years of shift work and PA levels.
Conclusions Shift workers spent more time walking than non-shift workers, but we observed no differences in other non-occupational PA levels. To better understand if and how PA plays a role in the negative health consequences of shift work, our findings need to be confirmed in future studies.
- Physical activity
This is an Open Access article distributed in accordance with the Creative Commons Attribution Non Commercial (CC BY-NC 4.0) license, which permits others to distribute, remix, adapt, build upon this work non-commercially, and license their derivative works on different terms, provided the original work is properly cited and the use is non-commercial. See: http://creativecommons.org/licenses/by-nc/4.0/
Statistics from Altmetric.com
What this paper adds
Physical activity (PA) is hypothesised to play a role in the adverse health effects of shift work, but the number of studies that have examined PA levels in shift workers is limited and, more importantly, detailed information on PA levels is lacking.
This study is, to the best of our knowledge, the first that took into account different PA types, different PA intensities and different aspects of sports in examining non-occupational PA levels of shift workers.
No differences in non-occupational PA levels between shift workers and non-shift workers were found, but shift workers did report spending more time walking than non-shift workers.
To better understand if and how PA plays a role in the negative health consequences of shift work, our findings need to be confirmed in future studies.
Introduction
In today's society, there is an increasing demand for service around the clock. Consequently, a substantial part of the workforce works outside the regular 09:00 to 17:00 office hours.1 However, increasing evidence suggests that shift work is related to the development of a variety of chronic diseases, such as cancer and cardiovascular diseases.2 In addition, recent reviews indicate that shift work may be linked to metabolic disorders and obesity.3 ,4
To develop effective intervention strategies, insight into the mechanisms linking shift work to these adverse health effects is needed. Lifestyle behaviours are thought to be among these underlying mechanisms, as working in shifts may unfavourably change workers' lifestyle behaviours, and consequently may increase shift workers' risk of developing chronic diseases and obesity.4–6 Physical activity (PA) is a lifestyle behaviour that is hypothesised to play a role in the adverse health effects of shift work.7–9 Currently, there is some evidence that shift workers are less physically active compared with non-shift workers.8–11 Shift workers may, for example, have less time and energy to be physically active during leisure time and to engage in organised team sports.8 ,10
Insight into the PA levels of shift workers could offer opportunities for the prevention of the negative health effects of shift work. However, the number of studies that have examined PA levels in shift workers is limited and, more importantly, detailed information on PA levels (type, intensity, duration) is lacking. Since the beneficial effects of PA may differ by PA type and intensity, using an overall PA measure is not sufficient to compare PA levels between shift workers and non-shift workers. For example, a recent meta-analysis indicated that leisure time PA (eg, walking or sports) is associated with a reduced risk of cardiovascular disease, while occupational PA has been shown to increase the risk of cardiovascular disease.12 In addition, health benefits have been found to be largest for vigorous-intensity PA compared with light-intensity and moderate-intensity PA,13 ,14 and an association between PA and reduced sickness absence has only been found for vigorous PA.15 ,16 These differences in the health effects by different types and intensities of PA stress the importance of gaining an understanding of the various aspects of the PA levels of shift workers compared with non-shift workers. Insight into non-occupational PA is of particular importance, as this PA domain offers good opportunities for preventive strategies.
The aim of the current study was to compare non-occupational PA levels between shift workers and non-shift workers. Furthermore, exposure–response relationships for frequency of night shifts and number of years of shift work regarding PA levels were studied.
Methods
Study population and design
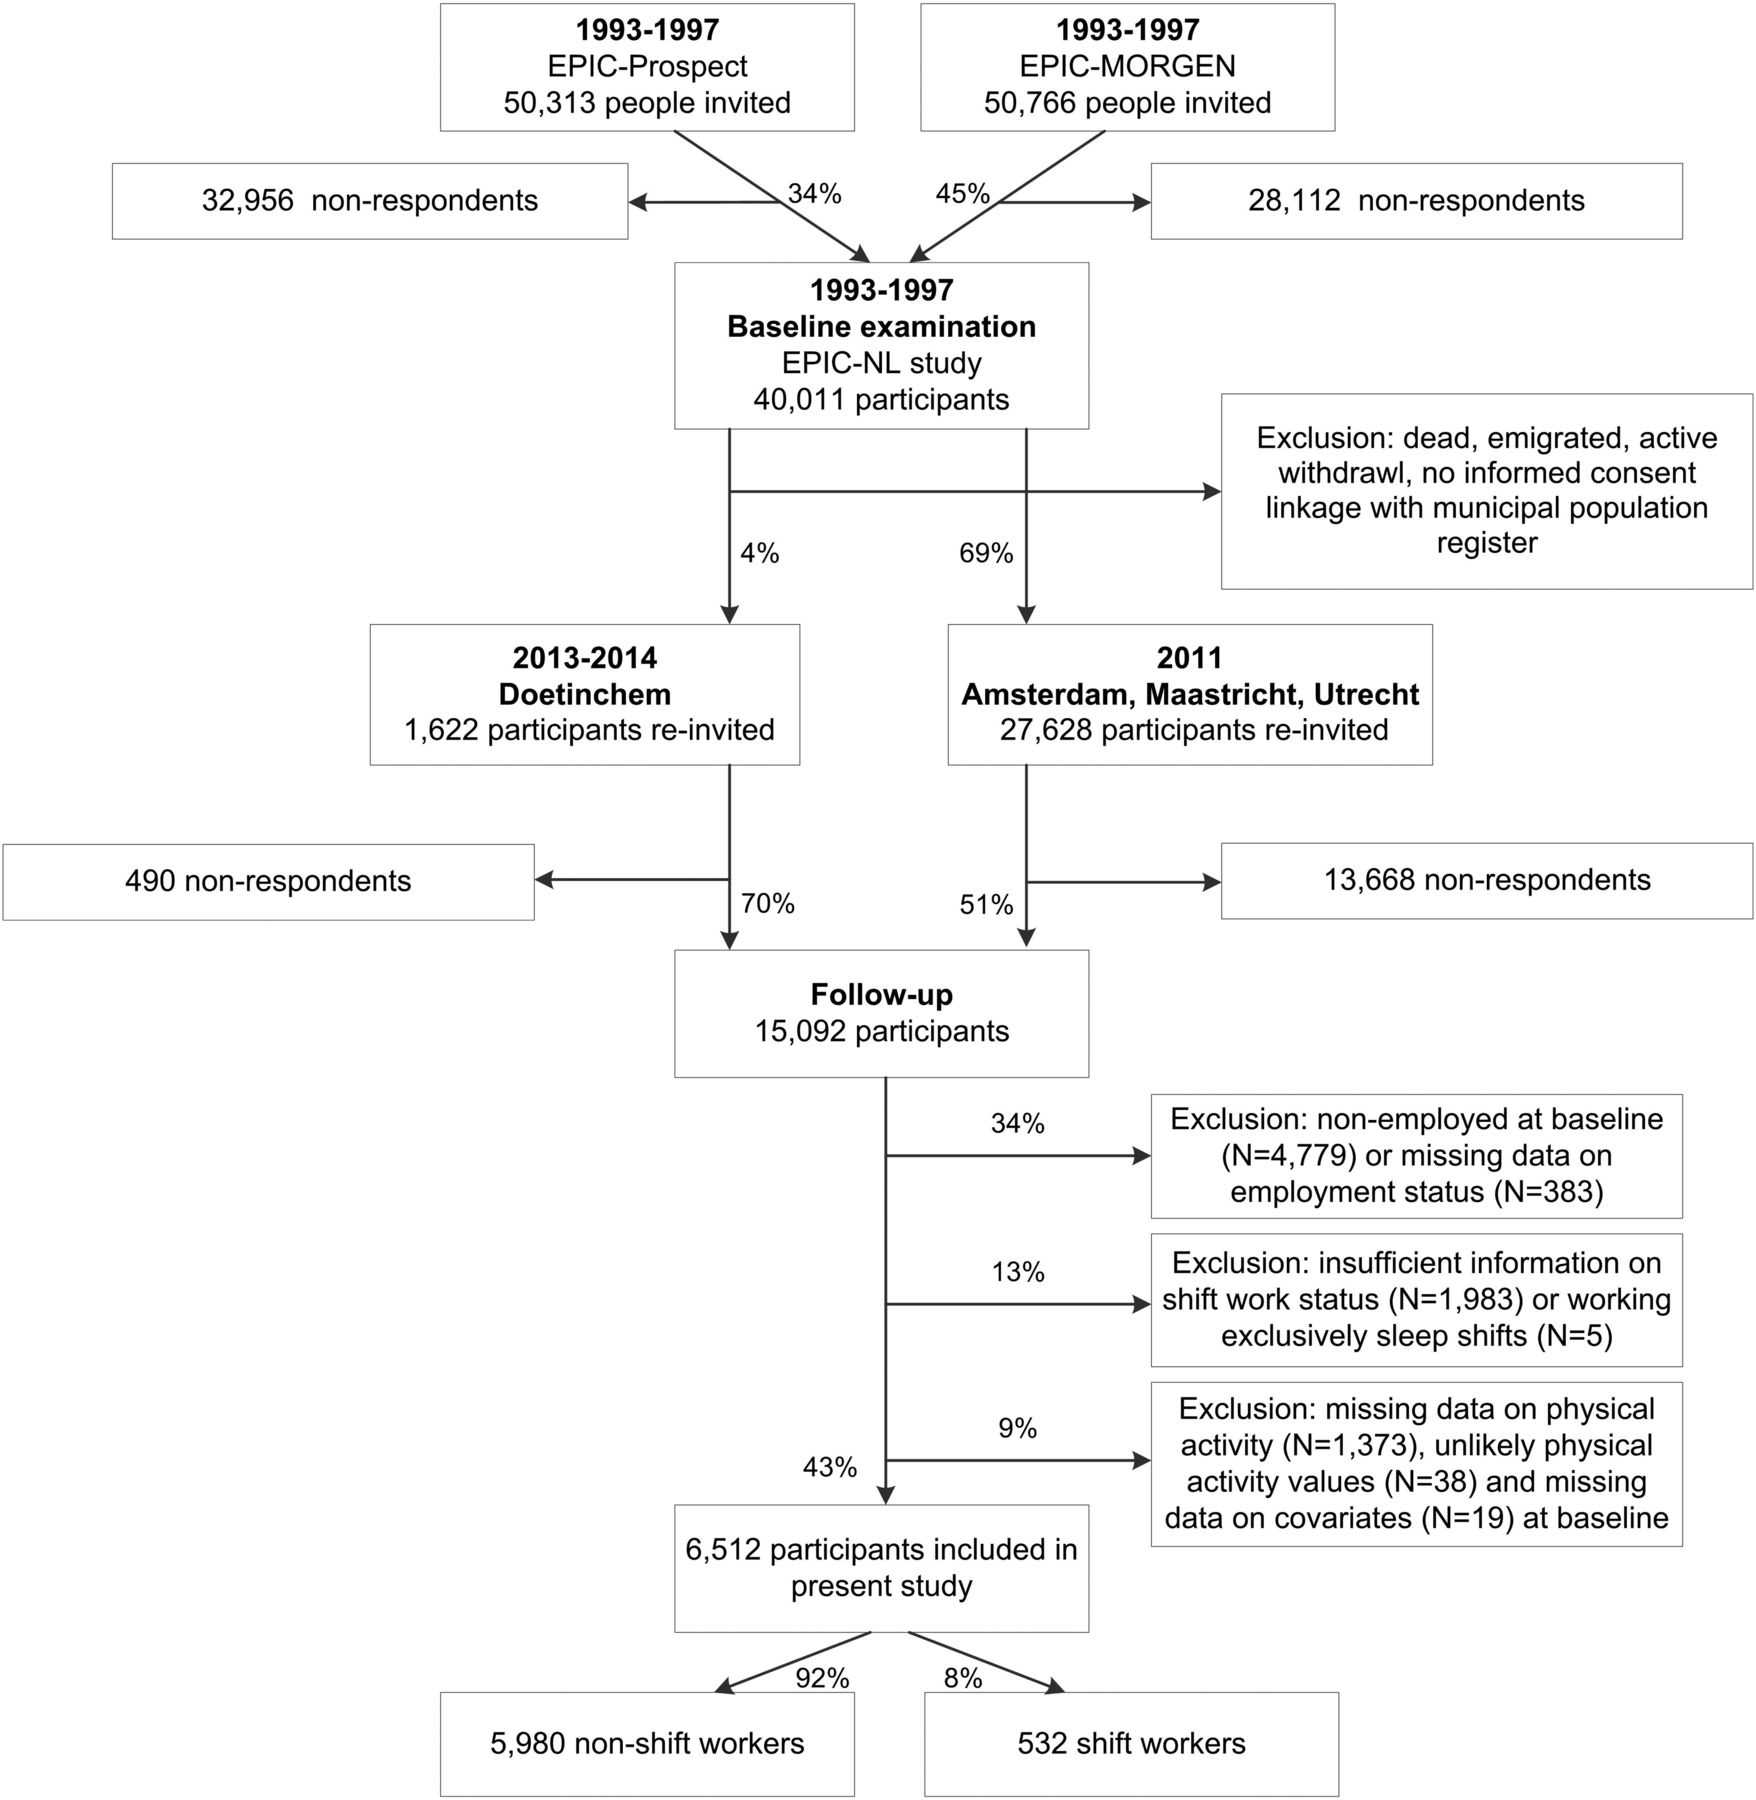
Data from the Dutch part of the European Prospective Investigation into Cancer and Nutrition-Netherlands (EPIC-NL) were used in this cross-sectional study. The aim of EPIC is to study relations between lifestyle behaviours and chronic diseases. EPIC-NL consists of two Dutch cohorts, EPIC-Prospect and Monitoring Project on Risk Factors for Chronic Diseases (EPIC-MORGEN), which were initiated between 1993 and 1997.17 EPIC-Prospect consists of 17 357 women aged 49–70 years living in and around the city of Utrecht who participated in the national breast screening programme. EPIC-MORGEN consists of 22 654 men and women aged 20–59 years who were recruited by taking random samples from the general population of three Dutch towns (Amsterdam, Doetinchem and Maastricht). All EPIC-NL participants (n=40 011) received a questionnaire addressing sociodemographics, lifestyle and health. Between 2011 and 2014, a follow-up questionnaire was sent to 29 250 participants, of whom 15 092 responded (figure 1). This follow-up questionnaire included questions about current and previous (shift) work status. Data from the follow-up questionnaire were used to retrospectively determine shift worker status at baseline, as analyses were performed on the PA data collected at baseline. In this study, 6512 workers with complete data on shift work status, PA and relevant covariates were used for analyses (figure 1).

Flow diagram of study participants. EPIC-NL, European Prospective Investigation into Cancer and Nutrition-Netherlands. EPIC-MORGEN, European Prospective Investigation into Cancer and Nutrition - Monitoring Project on Risk Factors for Chronic Diseases.
Measures
Shift work
Shift work status was assessed retrospectively in 2011–2014 by asking participants to indicate whether they ever worked evening shifts (ie, shifts ending before midnight), sleep shifts (ie, shifts in which one sleeps at work, but works if needed), night shifts (ie, shifts starting after midnight) and/or rotating shifts (ie, rotating between day, evening, sleep and/or night shifts). For each of these shift types, participants reported the starting and ending year and total number of years on the particular non-day shift schedule, and they reported the number of night shifts they worked per month. For the purpose of this study, participants who reported working exclusively evening shifts (n=60), exclusively night shifts (n=24) or rotating shifts (n=448) during the period when they filled out the baseline questionnaire (between 1993 and 1997) were labelled as shift workers; others were considered non-shift workers. Frequency of night shifts was categorised into 0, 1–4, or ≥5 night shifts/month. Years of shift work until the baseline measurement was categorised as 0, <10, 10–19 or ≥20 years of shift work. The aspects of shift work measured in this study have been identified as important domains of shift work by the international consensus report by Stevens et al.18
Physical activity
PA was measured using a questionnaire specifically developed for the international EPIC study.19 ,20 Validation studies showed that this questionnaire is suitable to rank participants according to their PA level.19 ,20 The questions relate to the participant's habitual PA level during the past 12 months measured at baseline (between 1993 and 1997). Since a different PA questionnaire was used in the first group of EPIC-NL participants in 1993, these participants were excluded from analysis. For occupational PA, participants were asked to indicate the present activities involved in their work. There were four possible categories: sedentary job (ie, most of the time sitting, such as in an office), standing job (ie, most of the time standing or walking, but intense physical effort is not required, eg, shop assistant, hairdresser), manual work (ie, some physical effort including handling of heavy objects and use of tools, eg, plumber, nurse, electrician) or heavy manual work (ie, very vigorous PA including handling of very heavy objects, eg, farmer, construction worker). Non-occupational PA (recreational, commuting and household activities) was measured by the amount of time (hours/week) spent in the following types of PA: walking (including walking to work, shopping and walking during leisure time), cycling (including cycling to work and during leisure time), exercise and chores (ie, combination of gardening, do-it-yourself and housework). To determine the intensity, every activity received a metabolic equivalent (MET) value based on the compendium of Ainsworth et al.21 By assigning (widely accepted) MET values to the different types of PA, a variable for moderate-intensity PA as well as vigorous-intensity PA could be established. Using the EPIC data manual guidelines, the following variables for PA intensity were created: moderate-intensity PA (3.0–5.9 MET; walking and chores) in hours/week and vigorous-intensity PA (≥6.0 MET; cycling and exercise) in hours/week.22 Participants were also asked whether they played sports (no vs yes). For EPIC-MORGEN, additional questions were asked about the specific sports activities the participants performed. Based on the nature and intensity of the sport they most frequently played, sports were classified as an individual or non-individual sport, and as a non-vigorous-intensity (<6.0 MET) or vigorous-intensity sport (≥6.0 MET).
Covariates
Included covariates were self-reported age, gender, marital status (married/living together vs not married/living together), level of education (low: advanced elementary education or less, moderate: intermediate vocational education/higher secondary education, high: higher vocational education/university), smoking status (never-smoker, ex-smoker, smoker) and Mediterranean Diet Score (MDS) (1–4 vs 5–9). A high score on the MDS scale corresponds to high adherence to the Mediterranean diet. The diet score was based on non-refined cereals, fruits, vegetables, potatoes, legumes, olive oil and fish, with no or limited intake of red meat, poultry, full fat dairy products and alcohol.23 These covariates were included a priori, because shift workers and non-shift workers may differ in terms of their sociodemographic status and lifestyle behaviours, and these factors may also be associated with PA, which could influence the association of interest.2 ,6 ,10 A subsample of the study population (n=4513) reported their job at baseline (1993–1997), which was categorised based on the International Standard Classification of Occupations 88 (ISCO-88) into the following occupational groups: white-collar outside healthcare (eg, teacher), white-collar inside healthcare (eg, nurse), blue-collar (eg, construction worker).24 Besides the common classification of occupational groups into white-collar and blue-collar, it was also decided to make a distinction between white-collar workers inside and outside healthcare, as the type of (shift) work and the physical effort that the (shift) work requires may be substantially different inside and outside the healthcare sector.
Statistical analysis
The characteristics of the study population, stratified for non-shift workers and shift workers, were described in percentages and means (SD). Owing to the positively skewed distribution of the PA type and intensity variables, Generalized Estimating Equations (GEE) linear regression models with robust SEs were used to compare PA levels between shift workers and non-shift workers. Separate analyses were performed for each PA type and intensity. For the sports activity variables, logistic regression models were used. For every PA variable, two regression models were constructed. Model 1 was adjusted for age, gender, marital status, level of education, smoking status and diet. Model 2 was additionally adjusted for occupational PA, because it was hypothesised that shift workers differ from non-shift workers with respect to the activity their jobs require. Effect modification was examined for gender and occupational group. Relevant effect modification was assumed if the p value of the interaction term was <0.05. Possible effect modification by occupational group was examined in the subsample of the study population that reported their job at baseline. In case of effect modification, stratified results were presented. GEE linear regression and logistic regression were also used to compare PA levels by frequency of night shifts (0 (reference), 1–4, ≥5 night shifts/month) and non-shift workers, and by years of shift work (<10 (reference), 10–19, ≥20 years) and non-shift workers. A p value smaller than 0.05 was considered statistically significant. All analyses were carried out using IBM SPSS Statistics, V.22.0 (IBM Corp, New York).
Results
Participants were on average 47.7±10.5 years old and 75.4% were female. Compared with non-shift workers, shift workers were younger, more often male, less often higher educated and more often a smoker (p<0.05). Most non-shift workers had a sedentary job (53.9%), while most shift workers performed manual work (37.4%). The reported mean hours/week spent walking was higher for shift workers (14.2 hours/week) than for non-shift workers (9.4 hours/week), while the mean time spent doing chores was lower for shift workers (14.6 hours/week) than for non-shift workers (15.8 hours/week) (p<0.05). Shift workers also reported spending more time on exercise (2.1 hours/week) than non-shift workers (1.8 hours/week), but the percentage of workers who played sports was similar for shift workers (54.5%) and non-shift workers (57.6%) (table 1).
Characteristics of the study population stratified for non-shift workers and shift workers
Table 2 shows that after adjustment for all covariates, shift workers reported to spend more time walking compared with non-shift workers (B=2.3 (95% CI 1.2 to 3.4)). Shift workers also spent more time in moderate PA (B=2.0 (95% CI 0.5 to 3.4)). No significant associations between shift work and the other PA types and vigorous PA were observed.
Regression coefficients and ORs of the differences in PA levels between shift workers and non-shift workers
Table 3 shows that after adjustment for all covariates, an overall positive exposure–response association was found between frequency of night shifts and walking. This means that shift workers who worked 1–4 night shifts/month (B=2.4 (95% CI 0.6 to 4.3)) and shift workers who worked ≥5 night shifts/month (B=3.7 (95% CI 1.8 to 5.6)) spent more time walking than non-shift workers. Furthermore, compared with non-shift workers, shift workers who worked 1–4 night shifts/month spent less time doing chores (B=−2.3 (95% CI −3.6 to −1.1)) and shift workers who worked ≥5 night shifts/month spent more time in moderate PA (B=4.1 (95% CI 1.7 to 6.4)). No other statistically significant associations were found between frequency of night shifts and PA levels.
Regression coefficients and ORs of the differences in PA levels by frequency of night shifts compared with non-shift workers†
Compared with non-shift workers, those who were working shifts for 10–19 years (B=3.1 (95% CI 1.3 to 5.0)) as well as ≥20 years (B=2.0 (95% CI 0.3 to 3.7)) spent more time walking (table 4). However, no exposure–response relationships were found for PA by years of shift work.
Regression coefficients and ORs of the differences in PA levels by years of shift work compared with non-shift workers†
Effect modification of occupational group
While gender was no significant effect modifier for any of the associations, the associations between shift work and walking, exercise, chores, vigorous PA and playing sports statistically significantly differed by occupational group (p for interaction<0.05) (see online supplementary table 1). For example, regression coefficients for the association between shift work (shift workers vs non-shift workers) and vigorous PA had an opposite direction for white-collar workers inside healthcare (B=−1.0 (95% CI −2.0 to 0.0)) compared with white-collar workers outside healthcare (B=0.6 (95% CI −0.1 to 1.3)) and blue-collar workers (B=1.1 (95% CI −0.2 to 2.3)). After stratification for occupational group, no significant associations were found between shift work and PA in any of the strata (see online supplementary table 1).
Supplementary table
Regression coefficients and odds ratios of the differences in physical activity levels between shift workers and non-shift workers, stratified for white-collar workers outside and inside health care and blue-collar workers
Discussion
In this Dutch working population, shift workers reported spending more time in non-occupational walking than non-shift workers. Owing to this difference in time spent walking, shift workers also spent more time in moderate PA than non-shift workers. There were no other differences in non-occupational PA levels between shift workers and non-shift workers. Furthermore, compared with the non-shift workers, shift workers spent more time walking at increased frequency of monthly night shifts. For the number of years of shift work, no exposure–response relationship with PA was found.
Previous studies on shift work and PA showed mixed findings with some of those showing shift workers to be less physically active outside work,11 ,25 ,26 while most studies did not find a difference in non-occupational PA levels between shift workers and non-shift workers.27–33 Differences in study findings may be explained by variations in study populations (different occupational groups, different sociodemographics), measures used to assess PA (including different definitions of non-occupational PA and moderate/vigorous PA) and definitions of shift work (eg, including or excluding shift workers without night shifts). Most of these earlier studies used self-reported measures of PA. However, Loprinzi (2015) objectively assessed PA and found that the overall level of moderate-to-vigorous PA did not differ between shift workers and non-shift workers.34 Loprinzi (2015) also reported that rotating shift workers engaged in more light-intensity PA and in less sedentary behaviour compared with non-shift workers.34 Although speculative, this may indicate that compared with non-shift workers, shift workers spend more time doing less-intense PAs such as walking, as was found in our study. Furthermore, previous studies used overall measures of non-occupational PA, such as total time per week spent in non-occupational PA and low or high level of non-occupational PA. Our study adds to those previous studies, because we compared multiple separate aspects of non-occupational PA between shift workers and non-shift workers instead of using overall PA measures. Nevertheless, based on previous research and this study, no sound evidence for an association between shift work and non-occupational PA can yet be provided. As this is, to the best of our knowledge, the first study that took into account the specific types and intensities of non-occupational PA in examining the association between shift work and non-occupational PA, our findings need to be replicated in other studies.
The finding that shift workers reported spending more time in non-occupational walking may be explained by the fact that walking is an activity that is relatively easy to incorporate in a shift schedule. However, caution in the interpretation of this finding is needed because of possible information bias in the measurement of walking. Since it is harder to precisely recall activities of lower intensity, the validity of walking may be lower than that of higher intensity activities.35 Moreover, although we aimed to measure non-occupational walking, it is possible that occupational walking was also included.35 This may lead to differences in reported time spent walking between shift workers and non-shift workers, as workers from all different occupational sectors were included in this study. Consequently, there is wide variation in the physical workload by shift work status, with shift workers generally performing jobs with higher physical demands than non-shift workers.36 This was also supported by our data, where shift workers were more often blue-collar workers and worked more often inside the healthcare sector than non-shift workers (table 1). Hence, a possible explanation for the finding that shift workers spent more time walking may be that participants also took into account their time spent walking at work when reporting their PA levels. After stratification for occupational group, the associations between shift work and walking became smaller and non-significant. However, this may have contributed to a lack of statistical power, as the stratified findings still pointed towards a positive association between shift work and walking for all occupational groups.
Besides for the PA variable walking, effect modification by occupational group was also observed for several other PA variables such as vigorous PA. However, no strong conclusions regarding the differences between occupational groups can be drawn on these stratified analyses since we observed no significant associations between shift work and non-occupational PA in any of the strata. Nonetheless, it may be worthwhile for future research to investigate the role of occupation in the association between shift work and non-occupational PA. Despite the observed effect modification by occupational class, the overall conclusion of this study remains the same when based on the stratified findings, that is, in general, no differences in non-occupational PA levels of shift workers and non-shift workers were found.
Our study showed an exposure–response relationship between frequency of night shifts and walking, with an increase in mean time spent walking with an increase in the number of night shifts per month. A possible explanation for this finding is related to the sleep behaviours of shift workers, as shift workers may experience a reduced sleep duration when working night shifts.5 ,37 Thus, the more the night shifts, the fewer hours shift workers sleep on average, and the more waking time may be left to spend on other activities that involve walking. Although the p-trend value was significant for moderate PA as well, we did not consider this to be an exposure–response relationship as the overall association between frequency of night shifts and moderate PA appeared to be not linear. Thus, no other exposure–response relationships were found between frequency of night shifts and PA levels, which is in line with a previous study from Peplonska et al.32 Furthermore, the absence of an exposure–response relationship between the number of years of shift work and PA levels is consistent with the findings of Wang et al.38 However, it differs from the findings of Peplonska et al,32 who found more years of shift work to be associated with less non-occupational PA. Owing to the mixed findings in the few studies examining exposure–response relationships for frequency and years of shift work and PA, it is not possible to draw final conclusions on this topic. Since specific characteristics of shift work, such as frequency of night shifts and years of shift work, may play an important modifying role in the association between shift work and health,2 ,18 it is recommended that future studies undertake a more detailed assessment of shift work exposure when examining the association between shift work and PA.
Strengths and limitations
Our study is, to the best of our knowledge, the first that took into account different PA types, different PA intensities and different aspects of sports in examining non-occupational PA levels of shift workers. It thereby provides a more adequate representation of the association between shift work and PA than the use of an overall PA variable. Furthermore, a methodological shortcoming in the current shift work literature is the limited assessment of shift work exposure.18 ,39 Specific characteristics of the shift work may affect the extent to which shift workers experience negative health effects.2 ,18 Therefore, examining the frequency of night shifts and years of shift work in relation to PA levels may provide further valuable information on the association between shift work and non-occupational PA. However, when interpreting the findings, it is important to bear in mind several methodological issues. Although the cross-sectional design was suitable for the descriptive aim of this study, that is, comparing non-occupational PA levels of shift workers and non-shift workers, no claims with respect to causality can be made. Furthermore, since shift work was assessed retrospectively, the exposure was measured after the outcome (non-occupational PA) in this study. Nonetheless, we believe it is unlikely that the measurement of shift work status was influenced by the earlier measurement of non-occupational PA, thereby limiting the risk of inducing differential recall bias. Moreover, although the retrospective measurement of shift work status makes our results susceptive to information bias, we consider this risk to be minimal, as being a shift worker has a significant impact on someone's life and is relatively easy to remember. PA was also measured using self-reported data. Previous research has indicated that people often overestimate their PA level,40 which is possibly also reflected by the high mean time spent in PA of our study participants. However, this has probably a small impact on our study findings, because we have no reason to assume that underestimation or overestimation of PA levels other than walking would be different in shift workers and non-shift workers.
The PA data in this study did not provide insight into the PA levels of shift workers during specific shift types. Therefore, it is still possible that PA levels of shift workers are on average similar to those of non-shift workers, but differ during weeks with and without specific shifts, for example, night shifts. Possibly, factors such as timing and frequency of PA may play a role in linking shift work to its adverse health effects, rather than the usual level of PA.10 Hence, future research on the usual and specific timing of PA levels in shift workers compared with non-shift workers is recommended.
Of the 40 011 EPIC-NL participants, 17 191 workers and 16 308 non-workers and participants with unknown work status were lost to follow-up or excluded due to missing data on shift work status, PA and/or covariates. Compared with the 6512 included workers, the excluded workers spent more time walking and cycling, but they played sports less often (p<0.05). Furthermore, the excluded workers were younger, more often male and less often higher educated (p<0.05). Although bias due to this selective exclusion cannot be ruled out, we still observed enough variation in the characteristics of our study sample. Therefore, we do not expect our conclusions to be substantially affected by the exclusion of these workers.
Conclusions
In conclusion, shift workers reported spending more time walking than non-shift workers, but no other differences in the non-occupational PA levels of shift workers and non-shift workers were found. Furthermore, time spent walking increased with an increase in the frequency of night shifts/month. Based on this study, it is unlikely that there are large differences in the average non-occupational PA levels of shift workers and non-shift workers. However, to better understand if and how PA plays a role in the negative health consequences of shift work, our findings need to be confirmed in future studies that also take into account different PA types and intensities, and frequency and years of shift work. In addition, research focused on specific timing of PA, for example, PA during night shift periods, is needed.
References
Footnotes
Contributors BL wrote the first draft of the manuscript with further contributions from GH, GCWW-V, WMMV, RCHV, MFB, AJvdB and KIP. BL and GH conducted the statistical analysis. KIP wrote the proposal for this particular study. All the authors interpreted the data, reviewed and edited the manuscript and approved the final version of the manuscript.
Funding EPIC-NL was funded by the ‘Europe against Cancer’ programme of the European Commission (SANCO); the Dutch Ministry of Public Health, Welfare and Sports; the Dutch Cancer Society; ZonMW the Netherlands Organization for Health Research and Development; and World Cancer Research Fund (WCRF). This study was funded by the strategic programme project 24/7 Health of the Dutch National Institute for Public Health and the Environment (RIVM).
Disclaimer The funding bodies had no role in the study design; collection, analysis, and interpretation of data; writing of the manuscript; or the decision to submit the manuscript for publication.
Competing interests None declared.
Ethics approval Approval was obtained from the Institutional Review Board of the University Medical Center Utrecht, Utrecht, the Netherlands (EPIC-Prospect) and the Medical Ethical Committee of TNO Nutrition and Food Research, Zeist, the Netherlands (EPIC-MORGEN).
Provenance and peer review Not commissioned; externally peer reviewed.
Data sharing statement Owing to ethical restrictions related to participant consent, all relevant data are available on request to WMMV, (monique.verschuren@rivm.nl).