Article Text

Abstract
Objectives The role of outdoor air pollution in the incidence of chronic obstructive pulmonary disease (COPD) remains unclear. We investigated this question using a large, nationally representative cohort based on primary care records linked to hospital admissions.
Methods A cohort of 812 063 patients aged 40–89 years registered with 205 English general practices in 2002 without a COPD diagnosis was followed from 2003 to 2007. First COPD diagnoses recorded either by a general practitioner (GP) or on admission to hospital were identified. Annual average concentrations in 2002 for particulate matter with an aerodynamic diameter <10 µm (PM10) and <2.5 µm (PM2.5), nitrogen dioxide (NO2), ozone and sulfur dioxide (SO2) at 1 km2 resolution were estimated from emission-based dispersion models. Hazard ratios (HRs) per interquartile range change were estimated from Cox models adjusting for age, sex, smoking, body mass index and area-level deprivation.
Results 16 034 participants (1.92%) received a COPD diagnosis from their GP and 2910 participants (0.35%) were admitted to hospital for COPD. After adjustment, HRs for GP recorded COPD and PM10, PM2.5 and NO2 were close to unity, positive for SO2 (HR=1.07 (95% CI 1.03 to 1.11) per 2.2 µg/m3) and negative for ozone (HR=0.94 (0.89 to 1.00) per 3 µg/m3). For admissions HRs for PM2.5 and NO2 remained positive (HRs=1.05 (0.98 to 1.13) and 1.06 (0.98 to 1.15) per 1.9 µg/m3 and 10.7 µg/m3, respectively).
Conclusions This large population-based cohort study found limited, inconclusive evidence for associations between air pollution and COPD incidence. Further work, utilising improved estimates of air pollution over time and enhanced socioeconomic indicators, is required to clarify the association between air pollution and COPD incidence.
This is an Open Access article distributed in accordance with the Creative Commons Attribution Non Commercial (CC BY-NC 4.0) license, which permits others to distribute, remix, adapt, build upon this work non-commercially, and license their derivative works on different terms, provided the original work is properly cited and the use is non-commercial. See: http://creativecommons.org/licenses/by-nc/4.0/
Statistics from Altmetric.com
What this paper adds
-
Outdoor air pollution is a potential risk factor for the development of chronic obstructive pulmonary disease (COPD).
-
Using a large, nationally representative cohort of patients registered with 205 English general practitioners (GP), we investigated the evidence linking exposure to particulate matter and gaseous pollutants to the first diagnosis of COPD recorded either by a GP or on admission to hospital.
-
We found limited evidence for associations, although these were comparable with existing cohort evidence based on smaller and less nationally representative populations elsewhere. However, given the ubiquitous nature of the exposure and the substantial burden of COPD on individuals and healthcare services, further work, utilising improved estimates of air pollution exposure for cohort participants, longer follow-up times and more precise disease definition, is required to clarify the role of air pollution in the initiation of COPD.
Introduction
Cohort studies have demonstrated associations between long-term exposure to outdoor air pollution and adverse health effects.1 Such studies, exemplified by the American Cancer Society cohort,2 ,3 have tended to focus on death as the health outcome with particular emphasis on fine particles and cardiovascular disease.4 Cohort studies of respiratory mortality have also tended to report positive associations but individually have lacked statistical power.5 Few studies have focused on chronic obstructive pulmonary disease (COPD).6 A recent report on the global impact of PM2.5 (mass of particulates with aerodynamic diameter <2.5 µm) on COPD was reliant on only three studies, all from the USA and all using mortality as the outcome.7
The possibility that air pollution is a risk factor for the initiation of COPD is important given the ubiquitous nature of the exposure and the substantial burden of the disease on individuals and healthcare services. Recent reviews of the literature have been, at the most, only suggestive of a role of ambient air pollution,6 ,8 and a recent multicentre cohort study reported limited evidence of associations with air pollution.9 Few studies have used objective measures of disease9 or routine databases such as hospital admissions records to identify cases.10 ,11
We have previously used a nationally representative cohort of adults in England to demonstrate positive associations between annual concentrations of air pollution and respiratory mortality including COPD.5 In this paper, we use a subset of the same cohort to look at the incidence of COPD over time identified from general practitioner (GP) records and from hospital admission records linked with the GP record.
Methods
The Clinical Practice Research Datalink (CPRD) is a large, validated primary care database that has been collecting anonymous patient data from participating UK general practices since 1987.12 It includes a full longitudinal medical record for each registered patient containing coded information on diagnoses, prescriptions and tests carried out within the practice. The Hospital Episode Statistics (HES) database routinely records clinical, patient, administrative and geographical information on all National Health Service (NHS)-funded inpatient episodes in the UK. Subject to the practice's approval, the CPRD patient data are routinely linked to HES by a ‘trusted third party’ via their NHS number, sex, date of birth and postcode and to the Index of Multiple Deprivation (IMD), a small area measure of deprivation used in England for allocation of resources.13
We identified 205 English practices, recording high-quality data according to CPRD internal standards (eg, non-contiguous follow-up, incomplete data recording),14 which had been linked to HES data.15 From these, we identified 836 557 subjects aged 40–89 years fully registered for at least 1 year on 1/1/2003. Subjects with COPD Read codes on their GP record prior to 2003 (n=24 494) were excluded leaving 812 063 for analysis. First diagnoses of COPD between 2003 and 2007 were identified from: (1) GP records by Read codes indicating a diagnosis of COPD and (2) hospital admissions records by International Classification of Disease codes (ICD-10 Version:2010) (J41–44) indicating a primary diagnosis of COPD. As a sensitivity analysis, we extended the exclusion criteria to include other markers of chronic respiratory disease recorded by the GP including asthma and regular inhaler prescribing (all Read codes available from authors on request). Figure 1 illustrates the cohort selection and exclusions.
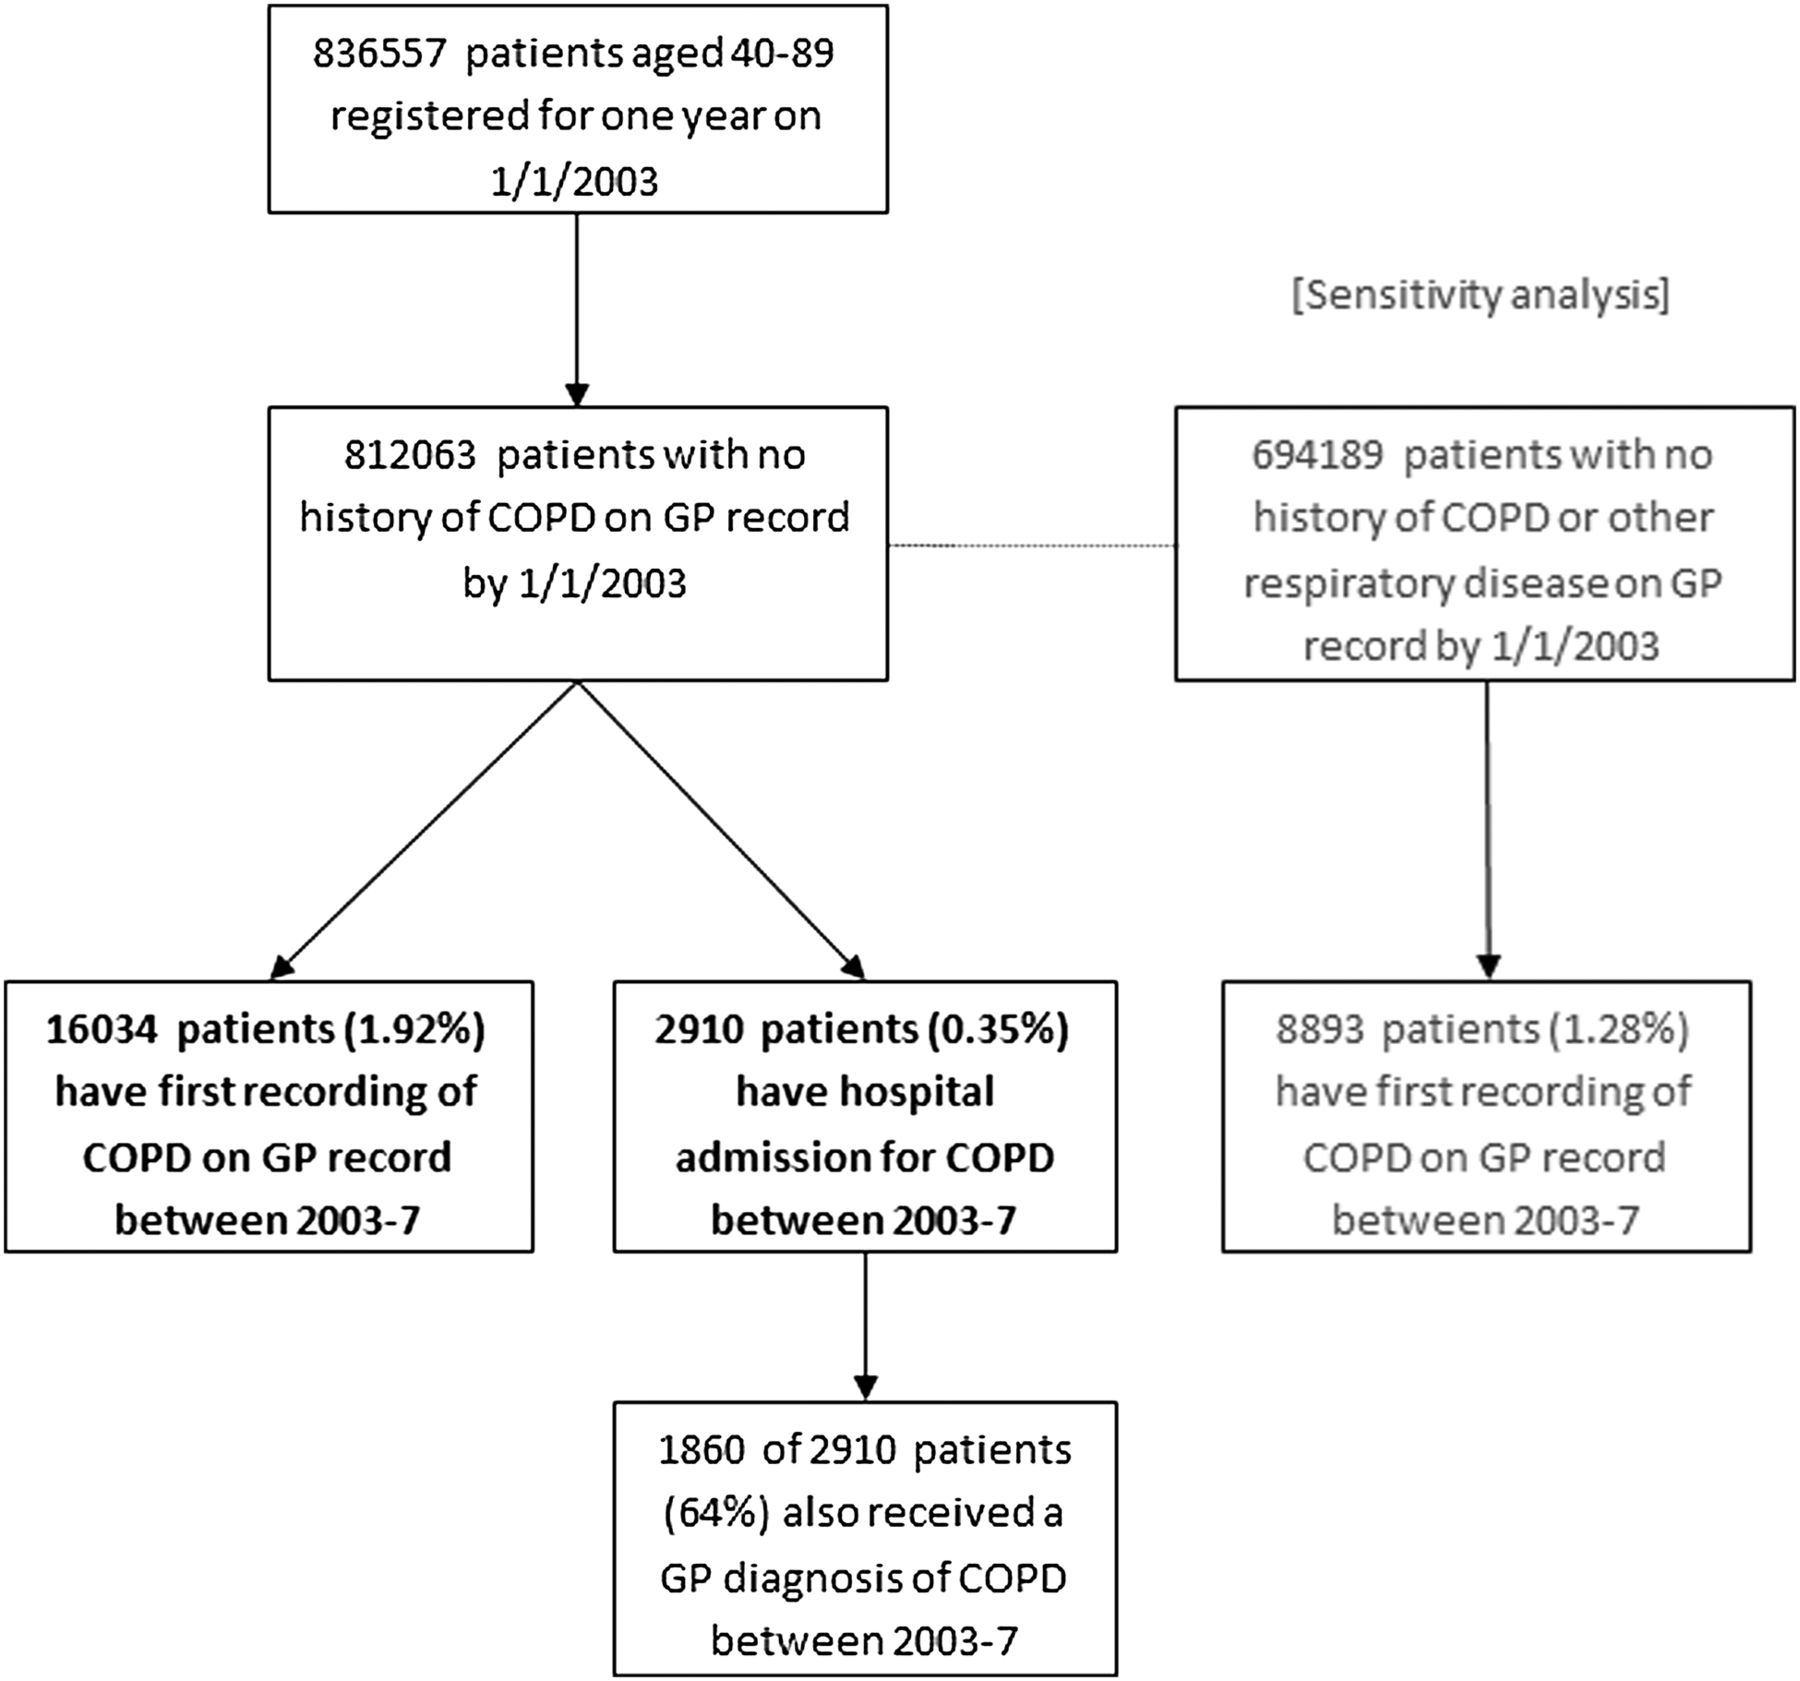
Cohort and case identification.
Annual mean concentrations in 2002 of particles with a median aerodynamic diameter of <10 μm (PM10), <2.5 μm (PM2.5), sulfur dioxide (SO2), nitrogen dioxide (NO2) and ozone (O3) for 1 km grid squares covering England were linked anonymously by the ‘trusted third party’ from a grid centroid to the nearest residential postcode centroid for each patient. Details of the dispersion models and the model validation including other years are provided in the online supplementary material. Briefly, the models for PM10, PM2.5, NO2 and SO2 were constructed by estimating emissions from a number of sources (eg, road transport or power generation) before calculating pollution concentrations using a dispersion model. O3 maps were constructed by interpolating data from rural monitoring stations and adjusting for effects of altitude and NOx emissions in urban areas.
Model validation was assessed using data from monitoring sites in the national network and from verification sites operated by NETCEN (part of AEA Technology Environment) in conjunction with local authorities and not part of the national network.16 Model validation was good for NO2 (R2=0.80 using the national network and 0.57 using verification sites), good for O3 (R2=0.48 and 0.71), moderate for PM10 (R2=0.29 and 0.46) and PM2.5 (R2=0.23 and 0.71), but poor for SO2 (R2=0 and 0.39).
Potential confounders extracted from the GP records included age, sex, smoking status (characterised as non/ex/current, with further categories of 1–19/20–39/40+ cigarettes per day) and body mass index (BMI) (<20, ≥20 and <25, ≥25 and <30, ≥30). The last recorded status before 1/1/2003 was used to code the variables, except for non-smokers, who were reclassified as ex-smokers if they had older historical codes indicating smoking. The amount of current smoking or ex-smoking was estimated by using the maximum cigarettes per day value and grouped accordingly. A ‘missing’ category was assigned for participants with no recorded smoking status prior to 2003. Individual measures of socioeconomic status (SES) were not available to us and we therefore assessed SES using 2007 IMD deciles, which are available for a small area comprising approximately 1500 people, modified to remove the air quality subdomain.15 Incidence rates of COPD, calculated from GP and hospital records separately, were compared across all confounders adjusted for age and sex (Stata V.12; StataCorp LP, College Station, Texas, USA).
We used Cox proportional hazards models (SAS V.9.1.3; SAS Institute, Inc, Cary, North Carolina, USA) to investigate associations between pollution concentrations in 2002 and incidence of COPD during 2003–2007. We adjusted cumulatively for (1) age and sex; (2) smoking and BMI and (3) IMD. In a sensitivity analysis, we assessed the impact on hazard ratios (HRs) after adjustment, in turn, for selected individual components of deprivation (income, employment and education). To account for clustering by practice, the modified sandwich estimate of variance was used to produce robust SEs. We further assessed the effect of clustering by fitting a random effect for practice using a shared frailty model in Stata. Two-pollutant models were considered only when the correlation coefficient between pollutants was below 0.5. We also carried out stratified analyses to assess effect modification by the covariates. To allow comparison across pollutants, HRs were quantified for an interquartile range (IQR) change in each pollutant. We also present the main estimates per 10 µg/m3 to enable comparison with results of other studies.
Results
Postcode linkage to all pollutants was successful in 99% of patients (table 1). IQR values were lowest for PM2.5 (1.9 µg/m3) and highest for NO2 (10.7 µg/m3). There was significant variation in modelled pollution concentrations by practice region and IMD (p<0.001). The highest concentrations of particles and NO2 were observed in London, whereas the highest concentrations of SO2 and O3 occurred in the north and south, respectively. Areas with a lower SES were associated with higher concentrations for all pollutants except O3. Annual concentrations of PM10 and PM2.5 were strongly correlated with NO2 (r=0.8), moderately correlated with SO2 (r=0.5) and negatively correlated with O3 (r=−0.4).
Summary of assigned pollutant concentrations in 2002 for participants with no diagnosis of COPD by end of 2002 (n=812 063)
Of the 812 063 cohort participants, 16 034 (1.92%) received a COPD diagnosis on their GP record and 2910 (0.35%) were admitted to hospital for COPD during the follow-up period 2003–2007 (figure 1). Of the 2910 patients admitted to hospital with a diagnosis of COPD, 1860 (64%) received a diagnosis of COPD on their GP record by the end of 2007. Extending the exclusion criteria for GP diagnosed COPD to patients with other previously recorded chronic respiratory diseases, such as asthma, reduced the cohort to 694 189 patients, with 8893 (1.28%) patients subsequently receiving an incident diagnosis of COPD.
Table 2 shows the incidence of GP and HES recorded COPD stratified by sex, age, smoking status, BMI, practice region and IMD. Incidence of GP diagnosed COPD was higher in men than in women (2.2% vs 1.8%), but the sex ratio was similar for hospital admissions. Incident cases of COPD increased with age, with only a small reduction in the oldest group (80–89 years) for GP diagnosed COPD. Increasing smoking intensity at baseline, both current and historical, strongly predicted COPD incidence. There was also a strong gradient with IMD, both for GP and hospital recorded COPD, with increasing incidence of both outcomes as deprivation increased. For example, using GP diagnoses, patients in the most deprived decile had an incidence rate almost four times higher than those in the least deprived decile (4.18–1.13%), while for hospital admissions this ratio was almost five (0.88% vs 0.18%). The pattern with IMD was observed across all smoking categories (data not shown). The strong associations with IMD were likely to account for some of the regional variation in COPD incidence, with higher rates in the north compared to the south. However, even among the most deprived IMD decile, north-south differences were still apparent (4.6% vs 3.4%).
Age–sex adjusted COPD incidence rates by baseline factors
The associations between an IQR change in assigned air pollution concentration in 2002 and a 5-year incidence of COPD recorded on the GP record and for admission to hospital are quantified in a series of HRs in table 3. All pollutants except ozone were positively associated with an increased risk for incident GP recorded COPD when adjusted for age and sex alone. Adjustment for smoking and BMI attenuated all associations, with further adjustment for IMD reducing nearly all associations to the null. The main exception was for SO2 where a 2.2 µg/m3 increment was associated with an HR=1.07 (95% CI: 1.03 to 1.11). Alternative adjustments for IMD based on individual components (income, education and employment) produced similar reductions in HRs (data not shown). Extending the exclusion criteria to also exclude patients with other previously recorded respiratory disease such as asthma strengthened associations for PM10 and PM2.5; however, CIs still included unity. In two-pollutant models, the SO2 association remained robust to adjustment for other pollutants (see online supplementary material table S3). Finally, alternative frailty models using a random effect to account for practice clustering did not materially alter our conclusions (data not shown).
Hazard ratios for the incidence of COPD for an interquartile change in each pollutant
Analyses using incidence based on an admission to hospital for COPD generally produced associations with air pollution greater in magnitude than those seen with GP diagnosis alone (table 3). Again, adjustment for covariates and IMD in particular markedly reduced associations, with all 95% CIs including unity. For example, IQR increments in PM2.5 (1.9 µg/m3), SO2 (2.2 µg/m3) and NO2 (10.7 µg/m3) were associated with HRs of 1.05 (95% CI 0.98 to 1.13), 1.01 (95% CI 0.97 to 1.07) and 1.06 (95% CI 0.98 to 1.15), respectively. The HR for ozone was 0.96 (95% CI 0.90 to 1.02). Restricting the analysis to admissions in participants with COPD confirmed by their GP did not materially alter our findings.
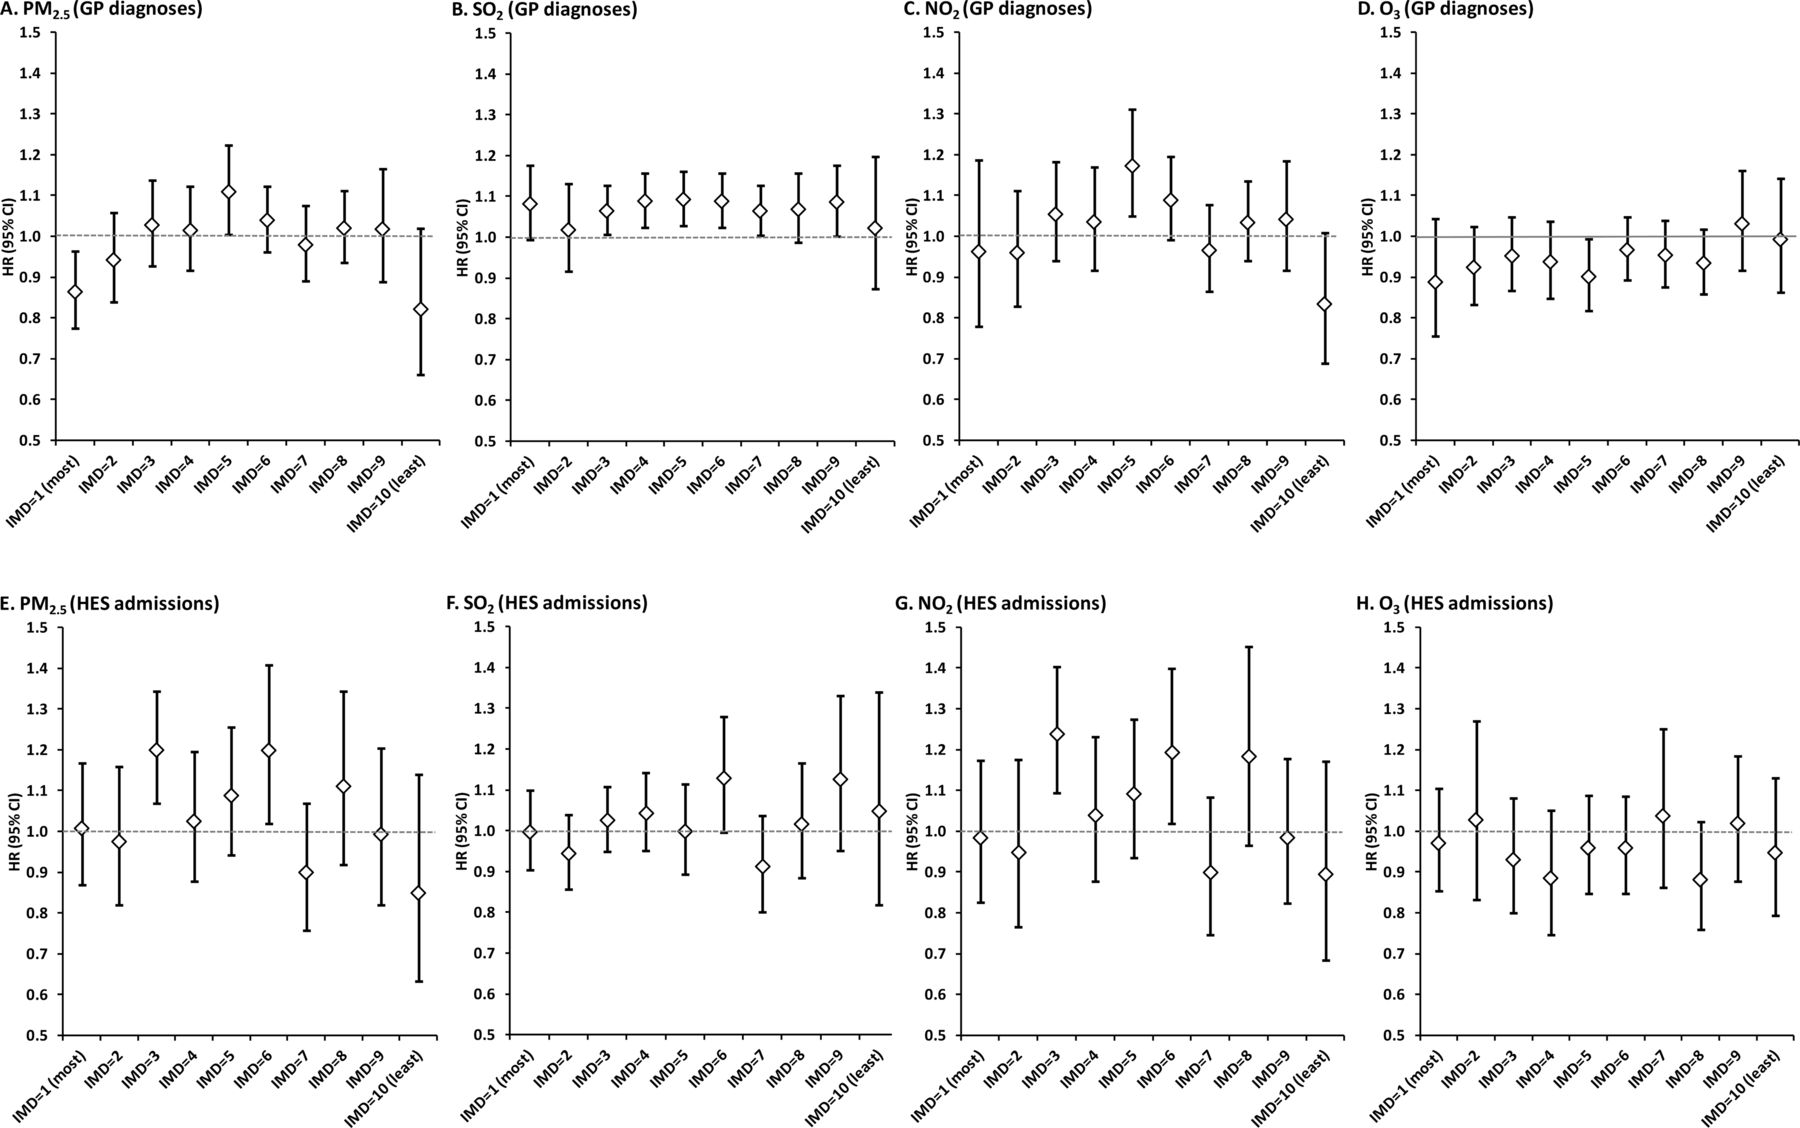
We stratified the adjusted HRs in table 3 by IMD deciles (figure 2). For PM2.5 and NO2, there was no consistent evidence of a positive association across different deprivation groups using either GP diagnoses or hospital admission as the outcome. For SO2, the association consistently produced an HR>1 for GP diagnoses, but was less uniform for hospital admissions. The reverse was true for O3 where the HR was generally <1 across the IMD deciles. Stratifying the analyses by other covariates such as age and smoking did not reveal any other patterns (data not shown).

Hazard ratios and 95% confidence intervals for the incidence of Chronic Obstructive Pulmonary Disease for an interquartile change in each pollutant stratified by Index of Multiple Deprivation deciles.
Discussion
In this cohort study of general practice patients, we investigated the relationship between estimates of long-term exposure to outdoor air pollution and the incidence of COPD recorded by GPs and by admission to hospital. While all pollutants except ozone were positively associated with increased risk for incident GP recorded COPD, adjustment for smoking, BMI and IMD in particular reduced associations towards the null except for SO2. Associations with COPD hospital admissions were larger and remained positive for PM2.5, PM10 and NO2 and negative for O3 after full adjustment, although all CIs included unity. Sensitivity analyses based on excluding asthmatic patients from the analysis, or only counting hospital admissions with a diagnosis confirmed on the GP record, did not alter our findings materially.
Early longitudinal studies of air pollution and the development of COPD used respiratory symptoms to identify participants with COPD17 ,18 while others used lung function measurements, such as forced expiratory volume in the first (FEV1)/forced vital capacity (FVC) ratio19–21 or the GOLD criterion.9 A very recent reanalysis and meta-analysis of four European cohorts (in total 6550 participants and including a UK cohort) used FEV1/FVC and the GOLD criterion to define COPD and found positive, but not statistically significant, associations with NO2 and PM10.9 Epidemiological studies designed to identify the small associations between air pollution and health outcomes require disease recording in large populations, which precludes the use of individual lung function measurements. Only a small number of studies have used routine administrative databases such as hospital admissions records to identify COPD cases. Andersen et al10 studied 57 000 participants in a Danish cohort recording their first admission to hospital for COPD between 1993 and 2006. COPD incidence was associated with 35-year estimated residential mean NO2 concentrations (HR=1.08; 95% CI, 1.02 to 1.14, per IQR of 5.8 µg/m3)—an association larger for the same increment in our study (HR=1.03). Gan et al11 also studied hospitalisations for COPD in a cohort of almost 500 000 residents in metropolitan Vancouver aged 45–85 years and without a previous physician diagnosis of COPD at baseline. Residential exposures to NO2 estimated from land use regression models were not associated with COPD hospitalisations (HR=1.00). They also found no evidence of an association with PM2.5 (HR=1.02 (95% CI 0.98 to 1.06) per 1.58 µg/m3 increment, which compares to HR=1.04 for the same increment in our study.
Our finding of an association between long-term exposure to SO2 and COPD is, to the best of our knowledge, new, although we note that this finding is specific to GP recorded COPD and hospital admission when confirmed by the GP. SO2 has been associated with respiratory mortality in some, but not all, cohort studies.5 Short-term exposure time-series studies have indicated associations between daily concentrations of SO2 and emergency hospital admissions for COPD22 but not GP consultations for lower respiratory disease excluding asthma.23 Given the lack of a plausible hypothesis linking current low levels of SO2 to health,24 it is possible that our finding reflects historical exposure to higher concentrations of SO2, or that our SO2 model, which showed an association with cardiovascular disease in a previous analysis,15 is providing a geographical proxy of poor overall health or acts as a marker for more toxic substances produced by the combustion of sulfur-containing fossil fuel.
We also found that associations with ozone were consistently negative, which we have seen previously with cardiovascular disease and mortality.5 ,15 While this is in part explained by negative correlations between ozone and the other pollutants, the smaller variation of ozone concentration by area probably results in it better representing regional levels. An analysis confined to the months in which ozone levels are highest might have been informative, but we were unable to stratify by season.2
In our study, we used two distinct data sources to identify COPD over time—GP diagnoses and hospital admissions. The use of a nationally representative UK primary care database to study COPD incidence has been established,25 but some important changes that might affect recording have taken place. One of the most notable changes was the introduction of the Quality and Outcomes Framework in 2004 which required GPs to confirm their COPD diagnoses by spirometry from 2006 onwards. This change may have temporarily introduced additional variability in the recording of diagnoses across practices. However, the introduction of spirometry should improve diagnostic certainty and lead to improved and more specific outcome measures for use in epidemiological studies of air pollution where large sample sizes are required to detect relatively small effects.
We also used hospital admissions for COPD as an outcome. Andersen et al10 noted the appeal of using an objective measure such as first-ever hospital admission assessed objectively from a nationwide register but recognised that such patients represented only those with severe or poorly controlled COPD. Hence, admissions are unlikely to represent the real burden of COPD in the population.10 In this respect, our study had the benefit of two large, quality assured, independent sources of data to identify incidence: hospital admissions records to identify participants at the severe end of the spectrum of disease and primary care records incorporating participants with COPD who had not yet required admission to hospital. However, the consistency in recording of a COPD diagnosis between the two was not complete—36% of incident hospital admissions for COPD were not confirmed by a corresponding GP diagnosis during the study. A sensitivity analysis restricting hospital admissions to those corroborated by a subsequent GP diagnosis of COPD did not alter substantively the associations observed with hospital admissions. While the use of large-scale databases allows us to detect small effects in large populations, the lack of consistency between the two outcomes limits the conclusions that can be drawn from each analysis.
We found that adjustment for deprivation had a substantial effect on all HRs, moving all associations towards unity and statistical non-significance. The direction of this adjustment is not surprising as lower SES has been shown to be related to poorer air quality and respiratory function in England previously.26 Adjustment for deprivation is important as it is associated with air pollution as well as other factors that might be correlated with COPD outcomes.27 We were limited by relying on census measures of deprivation based on a geographical area of approximately 1500 people;13 however, neighbourhood SES indicators can be an acceptable proxy for individual measures.28 It is possible that in urban areas the IMD may represent fine-scale variability in actual pollution levels not represented by our modelled estimates. For example, within the modelled 1×1 km area, patients living closer to busy roads are assigned identical exposure as those further away, but may have different deprivation profiles.29 While this may raise the possibility that we have overadjusted in our models, when we stratified our analysis by IMD deciles, we found little evidence of consistent effects of air pollution within the separate groups and no evidence of greater effects in areas of low socioeconomic characteristics.30 It is also possible that some of the IMD adjustment may be acting as a proxy for further smoking history, as our smoking variable was unable to calculate lifetime pack years.
We have discussed previously the performance and validation (see online supplementary material) of our air pollution dispersion models.5 We note that the validity of the modelled exposure data (as measured by R2 statistics in relation to monitored data) varied among the pollutants and from year to year. In 2002, our chosen year for exposure assignment, model validation was good for NO2, moderate for PM10 and poor for SO2, although this varied substantially from year to year (R2=0.23–0.45 at national network sites and 0–0.6 at the verification sites). Models for ozone demonstrated good to reasonable model performance. The difficulty in modelling PM and SO2 has been well documented31 ,32 and we note also that alternative pollution models have reported similar performance when applied to the UK.31 ,32 Other sensitivity analysis using exposure estimates averaged over a number of years, which include better validation statistics, largely confirmed our findings based on the 2002 data only including associations with SO2 (data not shown). Nonetheless, we believe that the poorer model performance for PM10 and SO2 relative to NO2 should be taken into consideration in the overall assessment of our results.
In comparison with other cohort studies of COPD, our pollution estimates differed in terms of spatial resolution (1×1 km grids vs residential,10 postcode11) and historical exposure (3510 and 5 years11). The question of historical versus recent exposure has been considered previously33 in relation to mortality in the American Cancer Society cohort3 and no strong evidence was found to support earlier over more recent pollution exposure estimates. Annual estimates of pollution concentrations from our model for other years around 2002 suggested strong correlations over time, so a single exposure year provides an acceptable proxy of longer exposure over time. However, we note that our estimates of pollution exposure may not adequately represent cumulative exposure over prior decades, especially where concentrations have generally been falling over time. A further limitation of our study was the relatively short follow-up period (up to 5 years), although this was mitigated to some extent by the size of the study population and number of events (>16 000 and >2900 incident COPD cases recorded by a GP and admission, respectively).
In a previous analysis of the same cohort,5 we found associations with COPD and respiratory mortality, which were comparable with those for hospitalisations reported in this case; however, owing to the relatively smaller number of mortality outcomes (less than 30%), the precision of our estimates was reduced. Hospital admissions may not represent a true incident point but may instead indicate the role of air pollution in exacerbating COPD. This hypothesis is supported by evidence from short-term exposure time-series studies which have found positive associations between daily concentrations of air pollution to increase in numbers of COPD hospital admissions and mortality in urban populations.22 ,34 ,35
In conclusion, this large population-based cohort study found only limited, inconclusive evidence for associations between air pollution concentrations and COPD incidence and inconsistency between results for COPD identified from GP records and from hospital admissions. Given the ubiquitous nature of the exposure and the substantial social and economic burden of the disease, further work utilising improved estimates of air pollution exposure for cohort participants, individual markers of SES, longer follow-up times and a more precise disease definition is required to clarify the role of air pollution in the initiation of COPD.
Acknowledgments
The views expressed in this paper are those of the authors and do not reflect the official policy or position of the MHRA. CPRD is owned by the Secretary of State of the UK Department of Health and operates within the MHRA. CPRD has received funding from the MHRA, Wellcome Trust, Medical Research Council, NIHR Health Technology Assessment programme, Innovative Medicine Initiative, UK Department of Health, Technology Strategy Board, Seventh Framework Programme EU, various universities, contract research organisations and pharmaceutical companies.
References
Supplementary materials
Supplementary Data
This web only file has been produced by the BMJ Publishing Group from an electronic file supplied by the author(s) and has not been edited for content.
Files in this Data Supplement:
- Data supplement 1 - Online supplement
Footnotes
-
Contributors RWA, IMC, AJK, TPvS, DGC and HRA contributed in the conception and design of the study. IMC, RWA, DGC and HRA contributed in analysis, interpretation and drafting of the manuscript.
-
Funding Department of Health Policy Research Programme Project: 002/0032.
-
Competing interests None.
-
Ethics approval NIGB.
-
Provenance and peer review Not commissioned; externally peer reviewed.