Article Text

Abstract
Background It has been suggested that dust exposure causes airway inflammation among cement factory workers. However, there is limited information on the mechanisms of this effect. We explored any associations between total dust exposure and fractional exhaled nitric oxide (FENO) as a marker of airway eosinophilic inflammation among cement production workers in Tanzania. We also examined possible differences in FENO concentration between workers in different parts of the production line.
Methodology We examined 127 cement workers and 28 controls from a mineral water factory. An electrochemistry-based NIOX MINO device was used to examine FENO concentration. Personal total dust was collected from the breathing zone of the study participants using 37 mm cellulose acetate filters placed in three-piece plastic cassettes. Interviews on workers’ background information were conducted in the Swahili language.
Results We found equal concentrations of FENO among exposed workers and controls (geometric mean (GM)=16 ppb). The GM for total dust among the exposed workers and controls was 5.0 and 0.6 mg/m3, respectively. The FENO concentrations did not differ between the exposed workers with high (GM≥5 mg/m3) and low (GM<5 mg/m3) total dust exposure. There was no significant difference in FENO concentration between workers in the two main stages of the cement production process.
Conclusions We did not find any difference in FENO concentration between dust-exposed cement workers and controls, and there were similar FENO concentrations among workers in the two main stages of cement production.
- Total dust
- Airway inflammation
- Fractional Exhaled Nitric Oxide
This is an open-access article distributed under the terms of the Creative Commons Attribution Non-commercial License, which permits use, distribution, and reproduction in any medium, provided the original work is properly cited, the use is non commercial and is otherwise in compliance with the license. See: http://creativecommons.org/licenses/by-nc/3.0/ and http://creativecommons.org/licenses/by-nc/3.0/legalcode
Statistics from Altmetric.com
Introduction
Several studies have reported associations between cement dust exposure, chronic respiratory symptoms and/or chronic obstructive pulmonary diseases (COPD).1–4 However, studies in developed countries show lower prevalence of chronic respiratory symptoms and/or COPD than those in developing countries. The lower prevalence may result from better dust control measures and relatively newer technology in developed countries than in developing countries. The mechanism of adverse effects of dust exposure on the respiratory system among cement factory workers is uncertain. Previous studies have suggested irritation of the exposed mucus membrane due to the alkalinity of cement.5 ,6 A study among Norwegian cement factory workers suggested airway inflammation due to an increase in percentage of neutrophils in induced sputum after dust exposure.7
Increased level of nitric oxide in exhaled breath (fractional exhaled nitric oxide (FENO)) is associated with airway eosinophilic inflammation in occupational settings.8 It is an objective, non-invasive method which is safe and easy to perform, and portable FENO monitors are reliable and useful for field work purposes.9 However, FENO is affected by several confounders such age, atopy, height, smoking and use of inhaled corticosteroids.9 ,10
Lund et al11 have reported higher FENO among 99 non-smoking Aluminium smelters than among 97 smoking aluminium smelters and 40 controls, suggestive of eosinophilic inflammation, a finding confirmed later by Sjåheim et al.12 A study among 29 underground tunnel construction workers shows higher FENO after 1 year of exposure to dust and fuel exhaust than among 26 outdoor workers.13 On the other hand, no significant differences in FENO concentrations were reported among American cement mason apprentices compared with controls, and among long term silica-exposed Finnish workers.14 ,15 Studies show varying concentrations of crystalline silica in dust samples from cement factories16 ,17 which may cause silica-related lung disorders, silicosis and lung cancer.18 However, studies on biomarkers of airway inflammation among cement factory workers are scarce. A recent study reported a small across shift decrease in FENO concentration among cement production workers in Norway, but the decrease did not show clear association with dust exposure and lung function changes.19 Further studies to investigate any associations between dust exposure and FENO concentrations among cement production workers are of importance.
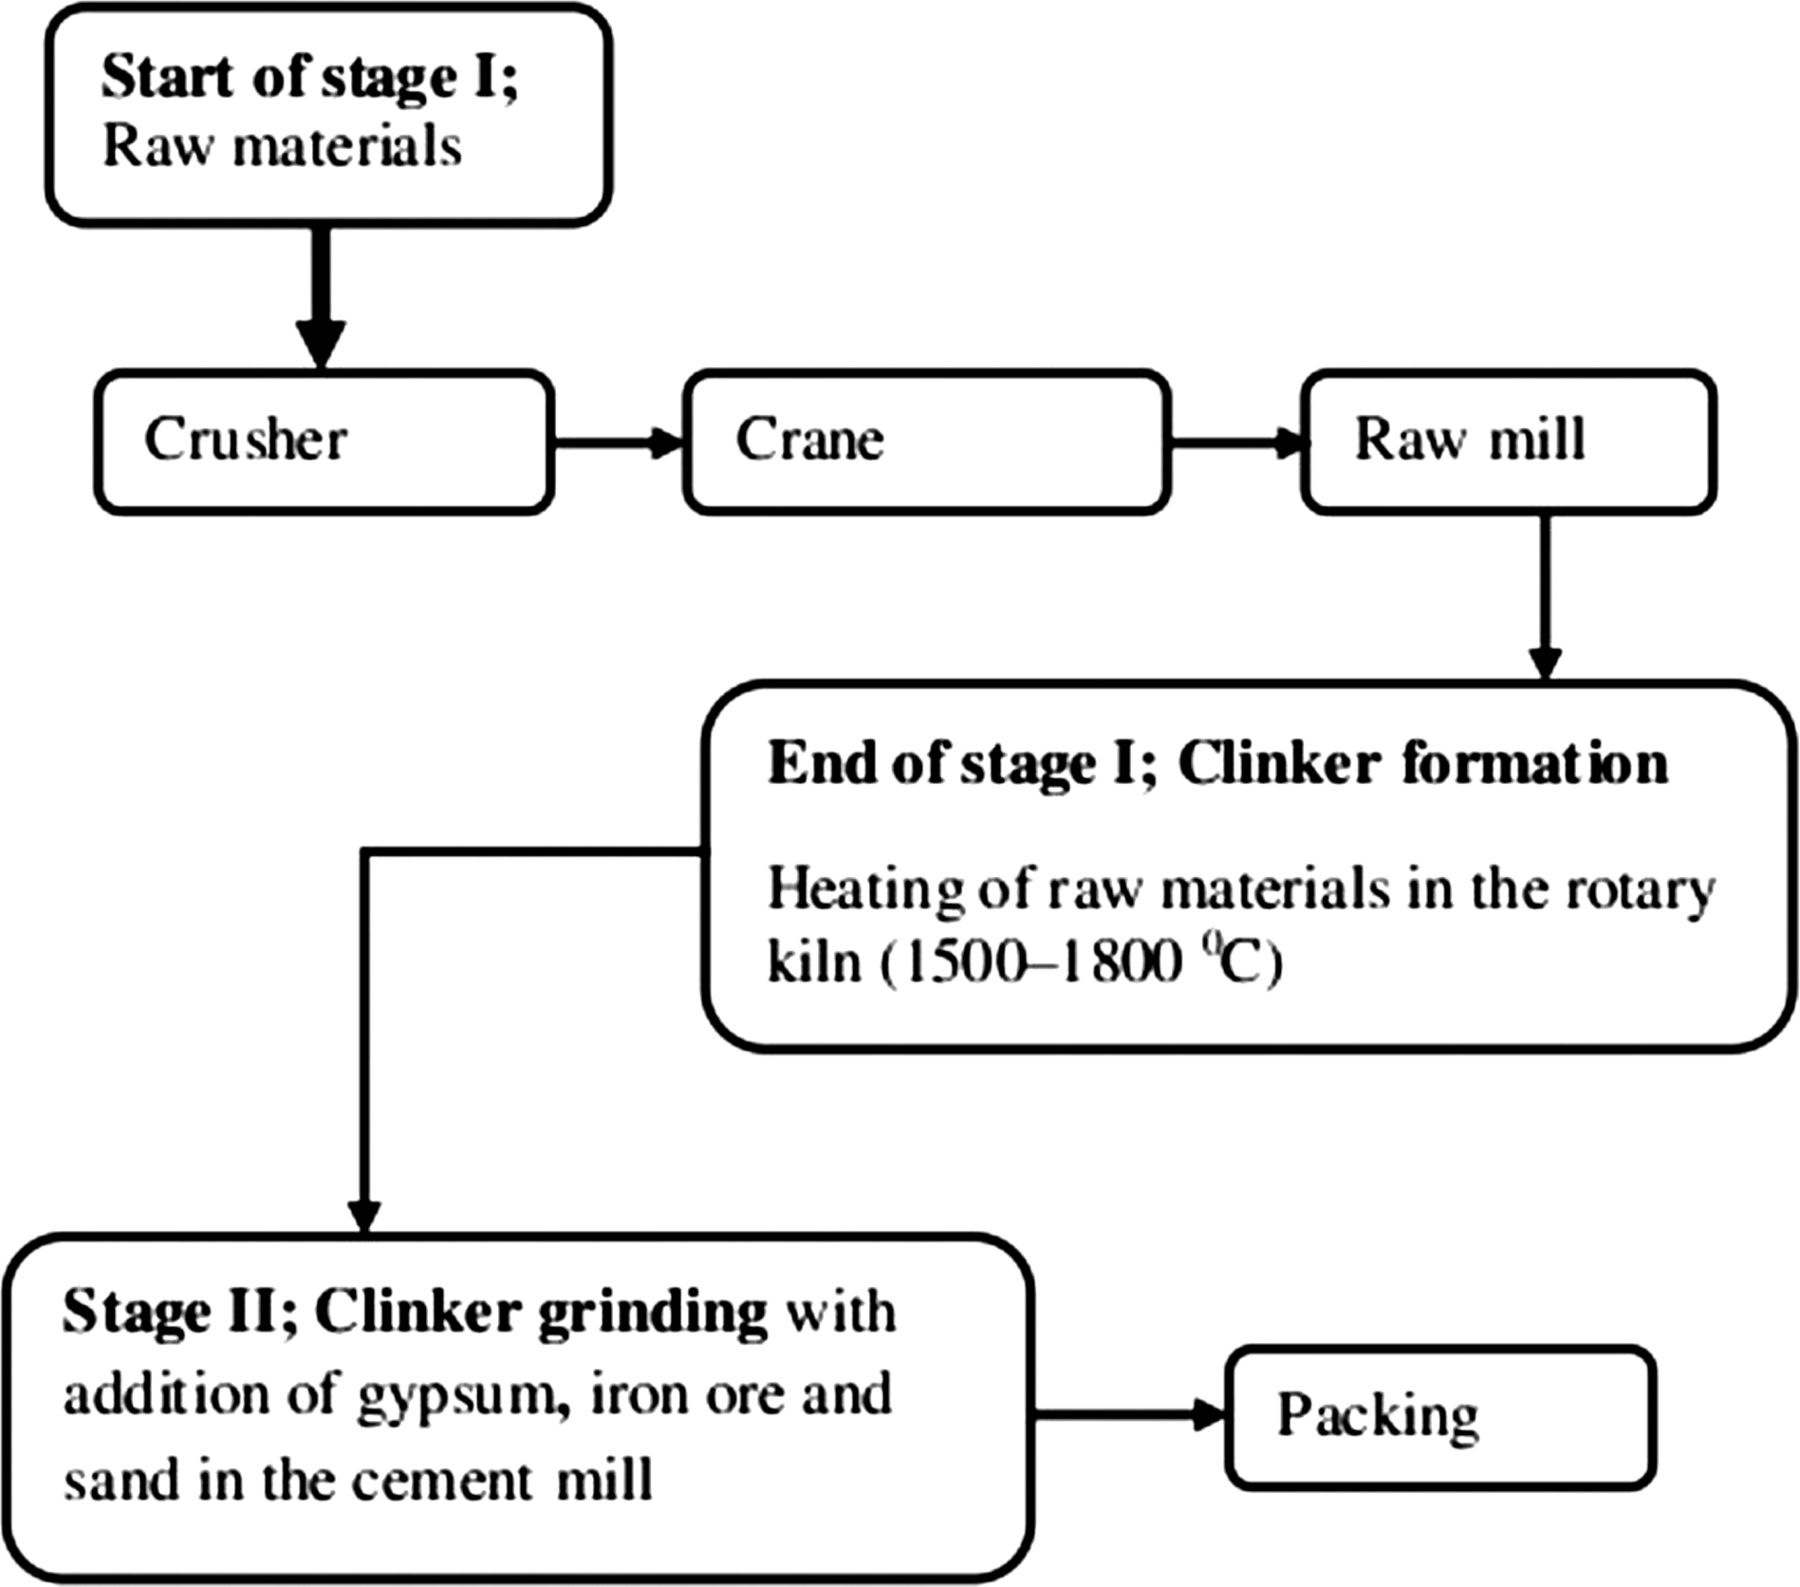
The principal raw materials used in the manufacture of cement are aluminium silicates (clays and shales) and calcium carbonate (limestone). The manufacturing process can be divided into two main stages: clinker formation (stage I), and clinker grinding and final product formation (stage II) (figure 1).20

Sections and the main stages in cement production.
In stage I, the raw materials from the quarry are crushed, ground in the raw mill, mixed, dried and heated under high temperature in the kiln (1500–1800°C) to form clinker, which is cooled and stored in a cement mill gantry. In stage II, the cooled clinker is mixed with gypsum and other additives to a required fineness and finally ground in the cement mill to produce cement, which is stored in silos ready for packing and transport.
Dust exposure varies with sections of production and with occupational groups (OGs). For instance, a previous study in the same factory in Tanzania as presently examined showed high total dust exposures among factory workers especially in the crane, crusher and packing sections.21 The highest exposure levels have been reported among Ethiopian and German cement factory cleaners.16 ,22 The Ethiopian study also has shown that by mass the coarser dust particles (>4 μm) predominate in cement factories, contributing to about 60% of the inhalable fraction. It might be assumed that workers in stage I could be exposed to coarser particles, due to the breakdown of bulky raw materials, than in stage II. The dust in stage II may also be more alkaline, resulting from clinker and the final product, than in stage I. However, differences in respiratory effects among workers in the two main stages of cement production have not been documented.
The aim of the current study was to explore the association between total dust exposure and FENO as a marker of airway inflammation among cement production workers in Tanzania, and to examine possible differences in FENO concentration between workers in stages I and II of cement production. We hypothesised that cement production workers had higher FENO concentrations than controls, with eosinophilic inflammation as a possible mechanism.
Methods
Study design and study setting
A cross sectional study was conducted between June and August in 2010 among production workers (exposed workers) in the oldest cement factory in Tanzania. The control group was recruited from a mineral water factory and was assumed to be exposed to low levels of dust. The cement factory was established in 1959 and is located 25 km north of Dar es Salaam city centre. In total, there were 495 workers in the cement factory, with 411 workers in the production section. The mineral water factory is located in Mikocheni Industrial Area, north of Dar es Salaam city centre, and had a total of 679 workers, with 349 workers in the manufacturing section. The mineral water factory was chosen because it is located in the same geographical area as the cement factory, had workers of similar socioeconomic status and the workers performed manual work like the cement factory workers.
There were three 8 h work-shifts arranged on a weekly basis in the exposed group: morning shift (07:30–15:30), afternoon shift (15:30–23:30) and night shift (23:30–07:30). Controls worked in a 12 h day shift and 12 h night shift, and each work-shift lasted for two consecutive days.
Study participants
Morning shift production workers in the cement factory and controls from the mineral water factory were eligible to participate in the study. The eligible participants were informed and invited to participate in the study through announcements made by the factory management teams. In both factories, we explained the study design first to the management teams and then to participants through meetings before we conducted the measurements. Using the personnel list, five to six participants were selected daily among exposed workers during the 6-week study period in the cement factory. The day shift list was used for random selection of controls during the 2-week study period in the mineral water factory. Only male production workers were selected because there were no female workers working in the production line in the cement factory.
A total of 210 exposed workers and 30 controls were invited to participate in the study (figure 2). Overall, 39 exposed workers did not participate, giving a response rate of 82.4%. All the invited controls participated in the study. Current smokers and participants with a history of asthma during childhood were excluded in the analysis (in total, 44 exposed workers and two controls), leaving 127 exposed workers and 28 controls to be analysed. Among the interviewed workers, 102 exposed and 12 controls were randomly selected for personal total dust sampling, and a total of 35 exposed and four controls were randomly reselected for repeated dust (second) sampling. A total of 11 dust samples among exposed were lost (figure 2), leaving 126 and 16 total dust samples among exposed and controls, respectively.

Study participants among controls and exposed group. FENO, fractional exhaled nitric oxide.
Questionnaire interview
All interviews on the participants’ background information were conducted in the Swahili language by one investigator (AMT) using a structured questionnaire. We asked about age and level of education (primary education or higher education levels). Participants were also asked about the duration of employment in the cement factory and in the mineral water factory, work section and how many years they had been working in the factory and if they had previously worked in other dusty industries. Workers in the cement factory were asked if they usually wore respiratory protective equipment (RPE) while working (yes/no). We asked whether participants had ever been treated for any of the following chest illnesses (yes/no): injury or operation affecting the chest, heart trouble, bronchitis, pneumonia, pulmonary tuberculosis and asthma. In addition, participants were asked about the use of medications for chest treatment, steroids (yes/no) or any other medications. Smoking habits were assessed by asking about ever smoking cigarettes (yes/no), current smoking cigarettes (yes/no) and time since they stopped smoking cigarettes (less than 1 year/more than 1 year). Current smokers or those who had stopped smoking less than 1 year ago were categorised as smokers while never-smokers or those who had stopped smoking more than 1 year ago were categorised as non-smokers. The non-smokers were subdivided into ever- and never-smokers.23
Fractional exhaled nitric oxide
FENO concentrations were measured using an electrochemistry-based NIOX MINO device (Aerocrine AB, Solna, Sweden). The device was precalibrated for a predetermined life span (300 measurements) from the manufacturer; hence this device did not require other calibrations in the field. All measurements were performed according to American Thoracic Society/ERS Standardized Procedure for FENO Measurements,10 except that only one measurement was taken from each participant each time FENO was measured. Studies have shown that one measurement is adequate when using the NIOX MINO device due to high reproducibility of this method.9 ,24–26 Height and weight were measured using a stadiometer and weighing scale, respectively. In the morning of the day of FENO examination, participants were advised not to eat or drink 1 h before the measurements were taken.10 All measurements were conducted in the Health and Safety Room in the cement factory, and in a company dispensary in the mineral water factory. The measurements of FENO were conducted daily between 14:00 and 16:00 to minimise any diurnal variations of FENO concentration.27 The FENO concentrations were categorised as low (<25 ppb) (eosinophilic inflammation is unlikely), intermediate (25–50 ppb) (non-specific inflammation) and high (>50 ppb) (significant eosinophilic inflammation) based on the American Thoracic Society guidelines for clinical interpretation of FENO concentrations.28 Room nitric oxide was recorded daily before the onset of FENO measurements. The sample size of FENO was based on a pilot study (in press) conducted among coffee factory workers in Tanzania where the mean concentrations of FENO were 28 and 14 ppb among exposed and controls, respectively, both with SD=15. With a significance level of p=0.05 and statistical power of 95%, 30 randomly selected persons were required in each observational group.
Exposure assessment
The sample size for dust exposure measurement in the observational groups was based on Rappaport and Kupper, suggesting 10–20 measurements per observational group (two measurements from 5 to 10 randomly selected individuals).29 Therefore, with five sections in the exposed group (figure 1), we needed a total of 50–100 samples. To achieve representative exposure for the workers, we collected 137 total dust samples among the exposed group.
Total dust samples were collected on preweighed 37 mm cellulose acetate filters with a pore size of 0.8 µm in a closed faced three-piece Millipore-cassette connected to a Sidekick Casella (SKC) pump (SKC Limited, Blandford Forum, UK) with a flow rate of 2.0 l/min. The cassettes were placed in the breathing zone of each study participant. The SKC pumps were calibrated daily using a rotameter before the sampling started and were checked at the end of the sampling time. The mean sampling time was 373 min (range: 145–538 min) among exposed and 348 min (range: 240–461 min) among controls.
Total dust samples were analysed gravimetrically in an ISO certified laboratory (Eurofins Product Testing, Denmark) using a Microbalance scale (Mettler scale AT 261). Filters where loose dust was detected on the cassettes were marked in the laboratory as overloaded, and for these samples, both loose dust and adsorbed dusts on the filters were weighed (n=16). In the kiln areas, gases such as nitrogen dioxide (NO2) and sulphur dioxide (SO2) from fuel exhaust may irritate the airway. These inorganic gases were measured using electrochemical sensors Dräger PAC III with a measurement range of 0.2–50 ppm for both NO2 and SO2.
Statistical analysis
Descriptive statistics
Both total dust levels and FENO concentrations were log transformed to achieve normal distribution. Independent t test was used to compare two groups while analysis of variance with post hoc test was used for multiple comparisons and χ2 test was used for categorical variables. Linear regression was performed using loge-transformed FENO as a dependent variable while adjusting for height, current dust exposure, duration of employment, ever-smoking (yes/no), working in other dusty industries (yes/no), RPE use (yes/no) and weight. Logistic regression was performed using FENO above or below 50 ppb as a dependent variable while adjusting for ever-smoking (yes/no), current dust exposure, duration of employment, stage of cement production (stage I or II), working in other dusty industries (yes/no) and RPE use (yes/no).
Occupational groups
In addition to comparing exposed workers and controls, we also made subgroups of the exposed group by using two grouping strategies, one a priori and one a posteriori grouping scheme.
The a priori grouping of dust exposure was based on stages of cement production; all workers in the crusher, crane, raw mill and kiln were categorised as ‘production stage I’ workers (clinker formation stage), while workers in the cement mill and packing were categorised as ‘production stage II’ workers (final product processing stage).
The a posteriori grouping scheme was based on dust exposure level (high or low). The exposed workers were categorised as combinations of section (crusher, crane, raw mill/kiln, cement mill and packing) and task: cleaners, production workers and central control room workers (CCR workers), forming a total of 10 exposed groups (table 1). In each of the groups, mean total dust levels were calculated. The exposed groups with geometric mean (GM) of total dust ≥5.0 mg/m3 were combined, forming the ‘high exposed group’ while exposed groups with GM of total dust <5.0 mg/m3 were combined, forming the ‘low exposed group’. By this method, cleaners in all sections and production workers in the packing section formed the high exposed group while production workers in the crusher crane, raw mill/kiln and cement mill formed the low exposed group.
Total dust exposure (mg/m3) among controls and exposed in different sections of a cement factory
Contrasts in exposure between production stages I and II and between low and high were examined by random effect and mixed effects models. Random effects models were used to estimate distinct between-worker (bwδ2) and within-worker (wwδ2) variances (full model) within the two grouping schemes (stage I/stage II and low exposure/high exposure). Participant's identity number and OGs were used as random effects in the model. Mixed effects models were applied to obtain common between-worker (bwδ2) and within-worker (wwδ2) variances (reduced model) for both subgroups within each grouping scheme when using the respective OG as fixed effects. For each grouping scheme, the restricted log likelihood test was used to compare the reduced model with common variances to the full model.30 Results from the restricted log likelihood test showed that the full model did not differ from the reduced model in stages I and II grouping scheme (difference=2.441; χ 22, 0.05=5.991) or in the high or low exposure grouping scheme (difference=20.748; χ 22, 0.05=5.991). This means that the assumption of common variance across the groups was validated for both grouping schemes.
Random effect models were then used to estimate variance components of between-group (bgδ2), within-group (wgδ2) and within-worker (wwδ2) variances using participant's identity number and the respective OG as random effects. Contrast in mean exposure levels between the OGs was calculated for each grouping scheme31 using the expression: 
Differences in exposure between OG were analysed by linear mixed models with OG as a fixed effect and worker as a random factor. A probability value of 0.05 or less was used as level of statistical significance. Statistical analysis was done using SPSS V.16 for Windows.
Ethical consideration
Ethical clearance was sought from the Western Norway Regional Committee on Medical Research Ethics and the Muhimbili University of Health and Allied Sciences Research and Publications Committee. Each study participant gave a written informed consent. No information about the individuals was at any point available to the employers.
Results
Study participants
The mean age, weight and duration of employment did not differ significantly between the exposed workers and controls (33 vs 35 years, 70 vs 72 kg and 7.5 vs 8.2 years, respectively). Both the exposed workers and controls had similar education levels (primary school only; 54% vs 56%, respectively). Height was the only variable that was different between the exposed workers and controls (164 vs 168 cm, respectively, p=0.007). The number of ever smokers among exposed workers and controls were 18 (14%) and 5 (18%), respectively. Only seven exposed and two controls had previously worked in other dusty industries. The use of RPEs among the exposed workers was 91%. None of the participants had a history of COPD, current asthma or use of corticosteroids.
Exposure assessment
The GM for total dust levels among exposed and controls were 5.0 and 0.6 mg/m3, respectively (table 1). The highest GM was among crusher cleaners (21 mg/m3), followed by production workers in the packing section (7.9 mg/m3), cleaners in the raw mill and kiln (7.6 mg/m3) and cleaners in the packing (6.2 mg/m3), while the lowest exposure was among production workers in the central control room (0.7 mg/m3). Results from random effect models show that the variance components in stages I and II grouping schemes were: bgδ2=0.056, wgδ2=0.870 and wwδ2=0.460 while the variance components in the grouping scheme by high or low exposure were: bgδ2=0.468, wgδ2=0.619 and wwδ2=0.495. The contrast obtained in the a posteriori grouping scheme of high or low total dust exposure was relatively high (c=0.430) while the contrast when grouping according to stages I and II was low (c=0.060).
Grouping by exposure level reduced the between-worker variability in the two subgroups (table 2). In the mixed model analysis, there was a significant difference in dust exposure level between the high exposed group and the low exposed group (p=0.001), but not between stages I and II. The concentrations of irritant inorganic gases NO2 and SO2, assumed to be present in fuel exhaust in the kiln areas, were below detectable limits.
Mean total dust exposure levels and FENO concentrations among controls, exposed and the exposed subgroups
Fractional exhaled nitric oxide
The exposed workers and controls had equal mean FENO concentration (GM=16 ppb) (table 2). There was no significant difference in FENO between ever- and never-smoking exposed workers (18 vs16 ppb, p=0.636), and between ever- and never-smoking controls (15 vs16 ppb, p=0.825). The lack of difference in FENO between the exposed workers and controls persisted after adjusting for height, current dust exposure, duration of employment, ever-smoking, history of working in other dusty industries, RPE use and weight. None of these factors had any significant effect on FENO. There was no significant difference in FENO concentration between exposed workers in stages I and II of the cement production process. Likewise, FENO concentration in the high and low dust-exposed groups did not differ significantly. The fraction of the exposed workers and controls with low and high FENO concentration did not differ significantly. However, there was a tendency of a higher fraction of workers with FENO above 50 ppb among exposed workers in stage I than in stage II. In both factories, the average concentration of nitric oxide in the examination room was 5 ppb.
Discussion
We did not find any difference in FENO concentration between exposed workers and controls, although the exposed workers had significantly higher total dust exposure (GM=5.0 mg/m3) than controls (GM=0.6 mg/m3). No significant difference in FENO concentrations was found between ever and never smokers. There was no significant difference in FENO concentration between the exposed workers in stages I and II of cement production or between cement workers with low and high total dust exposure. Furthermore, the fraction of workers with low and high FENO concentrations did not differ significantly between the exposed workers and the controls.
The lack of any significant difference in FENO concentration between exposed workers and controls agrees with a cross sectional study among 11 cement mason apprentices and 22 electrician apprentices in America.14 The lack of difference remained while controlling for height, current dust exposure, duration of employment, working in other dusty industries, RPE use and weight. However, a cross shift study among 95 Norwegian cement production workers reported a small decrease in FENO at 32 h when compared with baseline measurements, but there was no decrease in FENO when the baseline measurements were compared with those at 8 h.19 The Norwegian study did not have a control group and did not indicate at which time the FENO measurements were performed in relation to exposure, thus, making interpretation of the results difficult. A possible explanation of the results in the current study is that dust exposure among cement production workers may not be associated with eosinophilic inflammation of respiratory airways. Studies using other techniques have documented increase in blood inflammatory markers, percentage of neutrophils and interleukin-1β in induced sputum among cement factory workers which could also indicate stimulation of pro-inflammatory cytokines and neutrophilic inflammation.7 ,14 ,19 The FENO concentrations in our study are similar to those reported among 2200 randomly selected subjects from an adult Swedish population,32 non-smoking healthy subjects in the UK33 and normal adults in a random community survey in New Zealand.34
We observed high variability in dust levels in the exposed group. The dust levels were lower than those reported in a previous study from the same factory in Tanzania21 and from a study in Ethiopia16 but were higher than those reported in Norway.17 The highest levels of dust were found among cleaners in the crusher which is in line with those found in Ethiopia and Germany, although the dust level among Ethiopian cleaners was considerably higher.16 ,22 The proportion of dust levels above the exposure limit value of 10 mg/m3 for PNOS35 in the current study was also lower than previously reported in the Tanzanian21 and Ethiopian studies.16 The lower dust levels in the present study may be explained by the establishment of an additional new production line, installation of a new ventilation system in the old plant and repair of defective glass windows and doors of crane cabins. Also, a new air conditioning system had been installed in crane cabins and in crusher control rooms in the old factory.
In the present study, a grouping scheme based on low or high dust exposure was tested for a sufficient contrast using mixed effect models.21 ,29 This reduced bias due to misclassification of exposure. It has been reported that there may be a possible exposure–response association between exposure to dust in cement factories and changes in lung function indices and airway symptoms.4 A study in Germany showed a considerable variation in the actual content of cement in inhalable dust in cement factories.22 However, it is still unclear which impact this may have on the association between dust exposure in cement factories and lung function changes or on FENO.
A higher proportion of FENO above 50 ppb was seen among workers in stage I than stage II, but the finding was not statistically significant. This tendency may result from exposure to crystalline silica which may be higher in the first stage of production.16 ,17 A Finnish study reported elevated alveolar nitric oxide among silica-exposed workers, but no difference in FENO concentrations between controls and exposed workers.15 Thus, determination of alveolar nitric oxide among workers in the cement industry may possibly reveal similar results as those reported in the Finnish study.
A large proportion of exposed workers in the present study reported using RPEs. This may dilute any associations between the dust and FENO, causing underestimation of the effect of exposure.1 However, the FENO concentrations between RPE users and non-users were not different. This might be because the workers used disposable face masks (type FFP1) which are not efficient in preventing dust exposure in this type of working environment. Furthermore, we observed a considerable fraction of these workers performing different tasks without wearing RPEs. Therefore, they were probably less protected from the dust than reported during the interview.36
One strength of this study is the high response rate among study participants. However, we cannot totally exclude bias resulting from the non-participating workers, since we did not have prior information on their respiratory status. Nevertheless, we took into account the effect of potential confounders such as diurnal variations of FENO, sex, height, weight, ever- or never-smoking, childhood asthma, use of corticosteroids, room nitric oxide concentrations, and environmental NO2 and SO2 concentrations.
One limitation of this study is a possible healthy worker effect in both exposed and controls.37 Those who developed respiratory problems might have left the job in the cement factory, thus biasing our results towards no difference. We used a control group from a working population in the mineral water factory from the same area and with heavy manual work like the cement factory workers. The controls undergo pre-entry and periodical medical examinations as a specific requirement in food industries.38 Therefore, we cannot rule out that controls have less health problems than cement factory workers in general, and might thereby have affected our results. We did not perform skin prick test or measure IgE antibodies to identify atopics. Atopics have been reported to have higher FENO concentrations than non-atopics thus implying a risk of biasing our results.23 ,32 However, both the exposed and controls were located in the same geographical area thus minimizing bias due to exposure to common allergens outside the work places, and probably from major dietary differences. Furthermore, FENO changes are not specific and therefore cause difficulties in interpretation of our results.8 ,10 The period without dust exposure before FENO measurements which was not recorded may affect the study findings. Furthermore, repeated post-shift measurements of FENO over the work week might have revealed any time-dependent variability in FENO.
Our findings can presumably be generalised to the study population as well as to populations of cement factory workers with similar or lower total dust exposure levels. This study has revealed that eosinophilic inflammation measured using FENO as a biomarker may not be associated with total dust exposure among cement production workers.
Our results need a cautious interpretation and should not mean that exposure to dust in cement factories is harmless or that there is no risk of COPD. These results should only imply that FENO may not be a good marker of eosinophilic inflammation under conditions tested in this study. There is a need of searching for other biomarkers to reveal possible mechanisms of adverse effects of dust exposure on the respiratory system among cement production workers. Deliberate measures to reduce dust levels and appropriate RPE such as full face mask respirators among highly exposed groups should be considered.
In conclusion, our findings do not support the hypothesis that cement factory workers had higher FENO concentration than controls, and the exposed workers in different stages of cement production had similar FENO concentrations.
What this paper adds
-
There are no previous studies on the association between exposure to dust in cement factories and fractional exhaled nitric oxide (FENO) concentration as a marker of respiratory airway eosinophilic inflammation, based on total dust exposure level (low: geometric mean<5 mg/m3or high: GM≥5 mg/m3) and on the two main stages of cement production.
-
We did not find any significant difference in FENO concentrations between exposed workers and controls, between workers exposed to high and low dust levels or between exposed workers in the two main stages of cement production.
-
Eosinophilic inflammation of the respiratory airways using FENO as a biomarker is unlikely to occur among dust-exposed cement workers. There is a need to continue searching for biomarkers to reveal possible mechanisms of adverse effects of total dust on the respiratory system among workers in cement factories.
Acknowledgments
We would like to thank both the Cement and Mineral factory management teams and the workers for participating in the study. We extend our sincere gratitude to staff members and colleagues at the Centre for International Health, Department of Public Health and Primary Health Care (University of Bergen) and the Muhimbili University of Health and Allied Sciences who gave their valuable support during the study. Last, we thank the Eurofins Laboratory in Denmark for analysing the dust samples.
References
Footnotes
-
Contributors AMT planned and performed the study, analysed the data and revised the manuscript after consultation with the other authors. MB, SDM and BEM participated in planning and analysis, provided scientific support throughout the study, reviewed and commented on the manuscript. All authors have read and approved the final manuscript.
-
Funding This study was funded by the Norwegian State Loan Fund (Lånekassen) and the Norwegian Council of Universities Committee for Development Research and Education (NUFU) through the University of Bergen, Norway, in collaboration with the Muhimbili University of Health and Allied Sciences, Tanzania.
-
Competing interests None.
-
Patient consent Obtained.
-
Ethics approval The Western Norway Regional Committee on Medical Research Ethics and the Muhimbili University of Health and Allied Sciences Research and Publications Committee.
-
Provenance and peer review Not commissioned; externally peer reviewed.
-
Open Access This is an Open Access article distributed in accordance with the Creative Commons Attribution Non Commercial (CC BY-NC 3.0) license, which permits others to distribute, remix, adapt, build upon this work non-commercially, and license their derivative works on different terms, provided the original work is properly cited and the use is non-commercial. See: http://creativecommons.org/licenses/by-nc/3.0/