Article Text

Abstract
Objectives Workplace absences due to illness can disrupt usual operations and increase costs for businesses. This study of sickness absence due to influenza and influenza-related illness presents a unique opportunity to characterise and measure the impact of the 2009 (H1N1) pandemic, by comparing trends during the pandemic to those of previous years, and adding this information to that obtained by traditional epidemiological surveillance systems.
Methods We compared the numbers of cases of sickness absence due to illness caused by influenza and influenza-related illness in 2007–2009, and in the first 3 months of 2010 in Catalonia (n=811 940) using a time series approach. Trends were examined by economic activity, age and gender. The weekly endemic-epidemic index (EEI) was calculated and its 95% CI obtained with the delta method, with observed and expected cases considered as independent random variables.
Results Influenza activity peaked earlier in 2009 and yielded more cases than in previous years. Week 46 (in November 2009) had the highest number of new cases resulting in sickness absence (EEI 20.99; 95% CI 9.44 to 46.69). Women and the ‘education, health and other social activities’ sector were the most affected.
Conclusions Results indicate that the new H1N1 pandemic had a significant impact on business, with shifts in the timing of peak incidence, a doubling in the number of cases, and changes in the distribution of cases by economic activity sector and gender. Traditional epidemiological surveillance systems could benefit from the addition of information based on sickness absence data.
- Influenza A (H1N1)
- occupational health
- sickness absence
- occupational health practice
- investigation of outbreaks of illness
Statistics from Altmetric.com
- Influenza A (H1N1)
- occupational health
- sickness absence
- occupational health practice
- investigation of outbreaks of illness
What this paper adds
The emergence and spread of the 2009 H1N1 flu pandemic caused unusual morbidity and differed from previous influenza epidemics.
In Catalonia, the new H1N1 pandemic had a significant impact on business, with shifts in the timing of the peak incidence of cases of sickness absence due to flu and influenza-related illness, a doubling in the number of cases, and changes in the distribution of these cases by economic activity sector and gender.
Traditional surveillance systems could benefit from the addition of information on sickness absence, as this reflects business-related morbidity.
Introduction
Infectious respiratory diseases are among the most common illnesses, and viral respiratory infections, including influenza, cause significant morbidity.1 Influenza cases appear sporadically, in epidemics or in pandemics.2 Each year, seasonal flu (‘flu epidemic’) occurs during the late autumn and winter (from October to April and from May to September in the northern and southern hemispheres, respectively). It is estimated that 5–20% of the population get the flu each year; in a pandemic, this figure rises to over 30%.3
On 11 June 2009, the WHO4 5 declared a pandemic of a new strain of the H1N1 virus. In Spain, the Ministry of Health and Social Policy who, together with the social security system manages wage replacement and other benefits during periods of absence from work, implemented several preventive measures,6 7 and announced that people with suspected influenza qualified for short-term sickness absence and should remain at home.8 9 The pandemic, therefore, is likely to have had an important impact on business given its incidence in the young adult population, disruption of usual business operations and increased costs.10–13 This study of sickness absence due to influenza and influenza-related illness presents a unique opportunity to characterise and measure this impact, by comparing trends during the pandemic to those of previous years, and adding this information to that obtained by traditional epidemiological surveillance systems. In this study, we examined incident cases of sickness absence in Catalonia (Spain) due to flu and influenza-related illnesses from 2007 to the end of March 2010.
Methods
Time series data were collected for cases of sickness absence in the publicly insured working population of Catalonia (3 157 979 persons in mid 2010).14 This represents 99% of the employed population of Catalonia, and 82% of its economically active population, as registered by the Catalonian Statistics Institute (Idescat).15 Over the 39-month study period, a total of 3 701 072 episodes of sickness absence were recorded; of these, 811 940 cases, or 21.9%, had a diagnosis of influenza and/or an influenza-related illnesses.
Cases of sickness absence are initially certified by primary care providers in the national health service and, in Catalonia, are registered through the Catalonian Institute of Medical Evaluations (Institut Català d'Ávaluacions Mèdiques, ICAM). De-identified data were obtained on all incident cases from 1 January 2007 to 31 March 2010, and included diagnosis code (International Classification of Diseases, 9th Edition), start date of the absence period, sex, age and economic activity (n=11 sectors).
Two study periods were established: (1) the epidemic period (1 January 2007–30 September 2009) and (2) the pandemic period (1 October 2009–31 March 2010). The 1 October date was selected because this is the official annual start date of the Spanish national influenza surveillance program. The number of new sickness absence episodes per week due to influenza (ICD-9 codes 487 and 488) and influenza+influenza-related illness (codes 460–466, 480–486), as determined clinically by the primary care provider, were counted in total and by economic activity sector (n=11), age and gender.
The endemic-epidemic index (EEI)16 17 in the ith week of the pandemic period was calculated as the ratio between the observed number of influenza (or influenza+influenza-related) illness cases during the ith week of the pandemic period, and the expected number of cases, taken as the median of the numbers of cases during the same calendar week (eg, week 40) in the epidemic period, where i=1 (week 40 (2009)), 2 (week 41 (2009)),…, 26 (week 13 (2010)). The corresponding 95% CIs were calculated using the delta method,18 considering the observed and expected number of cases as independent random variables (see appendix 1 for more details about the calculation of the EEI and its confidence interval).
Lastly, we attempted to predict the a priori expected weekly number of influenza cases for the ith week of the pandemic period (ie, had there not been this new outbreak), based on the cases that had occurred between 1 January 2007 (week 1 (2007)) and 31 March 2009 (week 13 (2009)). For this, the expected number of cases based on the median of the number of cases during the ith week in the epidemic period was used. With this prediction, we compared weekly influenza trends that appeared with the new 2009 H1N1 pandemic to those that would have been expected in the absence of the pandemic.
All analyses were performed separately for influenza and for influenza+influenza-related illness as outcomes. We also analysed trends by economic activity sector, age and sex, although only the economic activity sector results for November 2009 are presented. Data for domestic housekeeping and extraterritorial agencies were excluded, as the numbers of cases were too small. All analyses were performed using Microsoft Excel 2007.
Results
Analyses were performed on a total of 157 447 influenza cases and 811 940 cases of influenza+influenza-related illness; of these, 50 220 (31.9%) and 159 600 (19.7%) cases of influenza and influenza+influenza-related illnesses, respectively, occurred during the pandemic period.
The economic activity sector with the greatest number of registered cases in the epidemic period was ‘industrial manufacturing and energy production’ (18.7%, n=20 051 influenza cases; 17.7%, n=115 773 influenza+influenza-related illnesses), and in the pandemic period, the ‘health, education and other social activities’ sector (23.4%, n=11 767 influenza cases; 23.0%, n=36 631 influenza+influenza-related illnesses). Males constituted a larger proportion of cases during the epidemic period (53.9%, n=57 761 influenza cases; 50.4%, n=329 071 influenza+influenza-related illnesses), whereas cases were more common among women during the pandemic period (51.8%, n=26 039 influenza cases; 54.2%, n=86 564 influenza+influenza-related illnesses). In both periods, the 25–34-year-old age group had the largest proportion of cases (table 1).
Distribution of cases of sickness absence due to influenza and influenza+influenza-related illness, 2007–2009 and 2010 (January–March) in Catalonia
The EEIs for the weekly distribution of sickness absences were highest in November 2009 (weeks 44–47 (2009)) for both influenza and influenza+influenza-related illness, peaking in week 46 (EEI46 20.99, 95% CI 9.44 to 46.69). Weekly EEI were statistically significant from October 2009 through the first 2 weeks in December 2009 (table 2).
Weekly distribution of cases of sickness absence episodes due to influenza and influenza + influenza-related illness, 2007–2009 and 2010 (January–March) in Catalonia
By economic activity sector, there was also a higher than expected number of cases in November (2009), peaking during week 45 for the ‘health, education and other social activities’ sector (EEI45 114.25, 95% CI 95.51 to 136.67). In this same month, most other economic activity sectors had their highest EEI during week 46. And weekly EEI for all economic activity sectors were statistically significant in November 2009 (table 3).
Weekly distribution of cases of sickness absence episodes due to influenza and influenza-related illness, November 2009 in Catalonia (pandemic period)
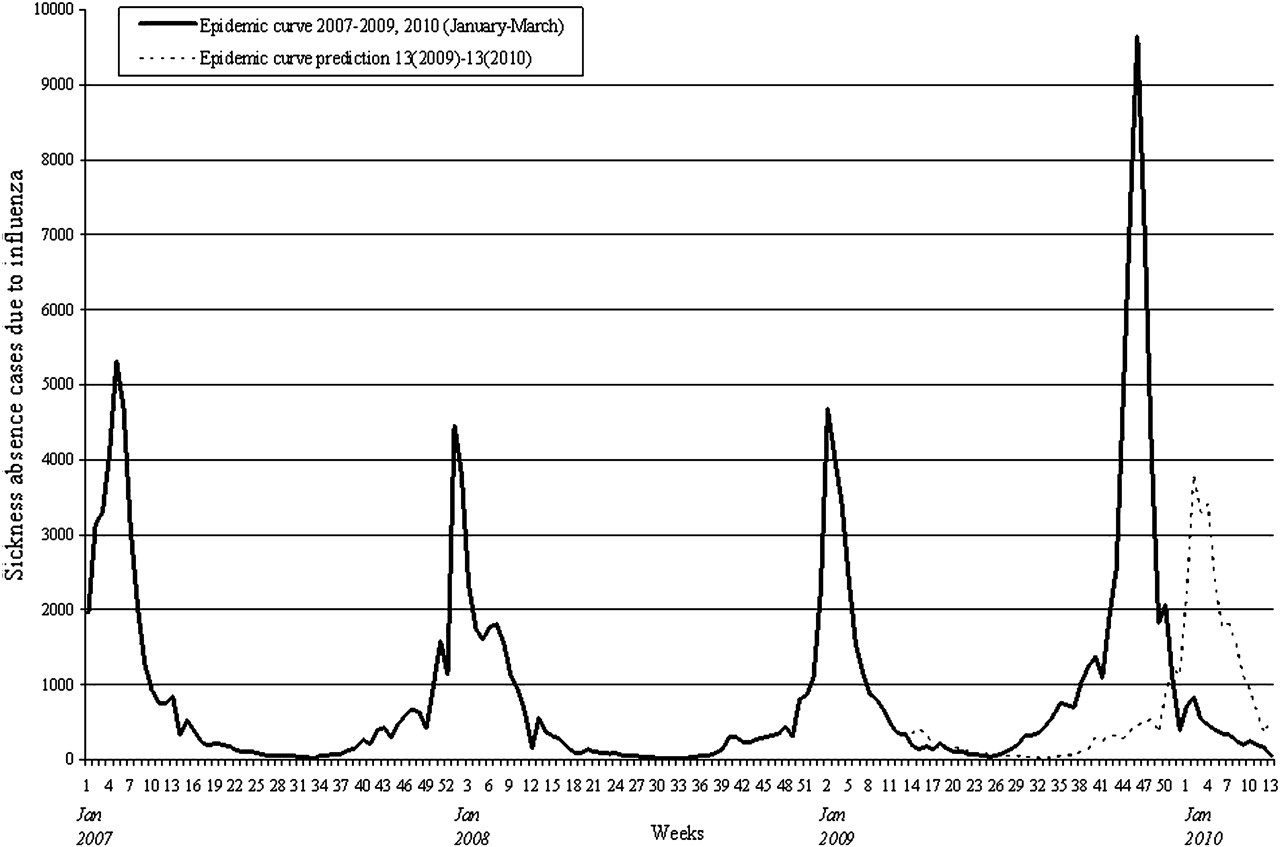
Figure 1 summarises the time series results for cases of influenza. In the epidemic period, influenza cases tended to cluster in January of each year (weeks 1–5 (2007, 2008 and 2009)), but during the 2009 H1N1 pandemic, this shifted to November (weeks 44–47 (2009)), and there were significantly more cases in 2009 compared to previous years. This same figure shows that, in the absence of the 2009 H1N1 outbreak, the a priori expected cases of influenza would also have clustered in January (2010) and would have been similar in number to those in the epidemic period. The predicted peak number of influenza cases occurs in week 4 (2010) (3801 cases), instead of the 9645 cases that actually occurred in week 46 (2009) of the pandemic. We found a difference of 5844 cases of sickness absence due to influenza between the observed and the expected weeks of peak influenza activity observed as shown by the respective ‘epidemic curves’ in figure 1. The results with stratification by sex, age and economic activity sector, showed a similar pattern to that in figure 1 with clusters in January of each year during the epidemic period and the expected cases during the pandemic period clustering in November (data not shown).
Temporal series of cases of sickness absence due to influenza, 2007–2009 and 2010 (January–March) in Catalonia and prediction for the period between week 13 (2009) and week 13 (2010).
Discussion
The study of sickness absence is complex, as absence is influenced by numerous factors, both clinical and socioeconomic. In addition to being an integrated indicator of health, sickness absence statistics also reflect economic and social burdens, due to the interplay of case incidence with other social-level conditions.19
In this study, we measured the impact of the new flu on sickness absence to provide data that supplement traditional epidemiological surveillance systems. The emergence and spread of the 2009 H1N1 flu pandemic resulted in unusual morbidity from a scientific point of view.20 21 Our results indicate that in Catalonia there were important differences in the number of new sickness absence episodes due to influenza and related illnesses, as compared to trends in previous years. These differences consisted of shifts in the timing of peak incidence, a doubling in the number of cases, and changes in the distribution of cases by economic activity sector and gender. Overall, the findings suggest that the patterns of sickness absence due to influenza are likely to have had important socioeconomic consequences for society.
The incidence and temporal patterns observed in our sickness absence database mirror the patterns of the pandemic detected by the usual influenza surveillance systems in both Catalonia and Spain22 23 and a preliminary study of sickness absence in Catalonia.24 While this validates our results to a certain extent, our findings go beyond traditional sentinel case-based and other public health influenza surveillance systems by also providing useful information on business-related morbidity.
We also found that the ‘health, education and other social activities’ sector had the largest number of cases during the pandemic, with a maximum EEI of 114.25 in week 45 (November 2009), a clear departure from previous years when the manufacturing and energy production sectors had the largest proportion of cases. One possible explanation for this finding could be that, although it was not known whether the pandemic would differentially affect industry, certain sectors, either due to a perceived higher risk of exposure to infectious cases or a greater risk of illness spreading to colleagues and/or clients (eg, in schools and healthcare settings), attracted greater attention from the media and public health agencies. This, in turn, led to the development of specific guidelines and recommendations in order to better protect workers and reduce the spread of disease,25 26 increasing the coverage of vaccination programs, which were historically low among teachers and healthcare workers.27 28
The greater incidence and absolute counts of sickness absence observed during the pandemic period are most likely due to the high virulence of the new strain of virus and/or the effect of the preventive measures recommended by health authorities, which generally favoured workers staying at home if suspected of having flu. Moreover, some sickness absence may have resulted from healthy working family members caring for a dependent with flu. The change in the distribution of sickness absence by gender, with women making up a greater proportion of cases during the pandemic period, could be explained in part by their greater presence in the health and education workforce compared to the manufacturing sector. In 2009, women made up 72% and 65% of the health and education sectors, respectively.29 Moreover, previous studies suggest that women are more likely to stay at home to care for a dependent family member who is ill.30 Unfortunately, we were unable to estimate the incidence of sickness absence in the total worker population by gender and economic activity due to inability to link our data with weekly counts of the employed workforce in Catalonia.
In Spain, wage replacement during temporary sickness absence is based on worker pay grade, and covered by the company between the 4th and 15th days of an episode. After the 15th day, wages are covered either by the social security system or an insurance company.31 During the 2009 H1N1 outbreak, the Spanish Ministry of Health and Social Policy accepted the argument that influenza A virus is typically eliminated from respiratory secretions within 7 days,9 so wage replacement for sickness absence (typically, 60% of base pay) during this period would primarily have been the responsibility of the company.32 The indirect costs related to medical expenses, decreased productivity and worker illness would have to be added to the costs to companies, the social security system and insurance companies. Unfortunately, we did not have information on duration of individual sickness absence episodes or on actual individual worker base pay, both of which would have allowed total direct costs to be estimated.
The main limitation of this study was the inability to ascertain the medical diagnosis that resulted in sickness absence which, in the case of influenza, is usually not confirmed microbiologically. Even during the 2009 H1N1 pandemic, diagnoses were not usually serologically based because of high cost; instead, this level of diagnostic evaluation was limited to essential physicians in the Catalonian national health service.33 Hence, we were unable to distinguish 2009 cases due to H1N1 from those due to other strains during the pandemic period, although as shown by the influenza surveillance systems in Spain and Catalonia, during the autumn of 2009, over 90% of laboratory confirmed cases were due to the new influenza virus A (H1N1).23 34 This does not lessen the value of our study, however, because the main objective was to assess the impact of a new influenza strain on a working population, and whether this impact differed from that of previous years. Regardless of whether some cases were incorrectly diagnosed as influenza, either during the pandemic or in previous years, the social security system handled them as de facto influenza cases, as determination of sickness absence is based on the primary care physician's diagnosis.
We should also note that, in addition to the number of new cases, the duration of the sickness absence period contributes to the impact of the pandemic, especially as this duration may have been longer than usual given recommendations from the local health authorities (which varied over the course of the pandemic), particularly for certain economic activity sectors, such as healthcare and education.
In summary, the 2009 H1N1 pandemic differed from recent influenza epidemics, as shown by an increase in the number of cases resulting in sickness absences, earlier peaking of the case burden, and a differential impact on certain sectors of the economy and women. Traditional epidemiological surveillance systems could benefit from the addition of information based on sickness absence data, as this reflects the impact on business. Continued epidemiological surveillance of sickness absence is necessary to determine whether this trend has continued or returned to pre-pandemic patterns. It would also be important to assess the effectiveness of vaccination programs, targeting those populations that appear to have differentially been affected by the influenza pandemic.
Appendix 1
Let Oi represent the observed number of influenza (or influenza+influenza-related) illness cases during the ith week of the pandemic period, and Ei be the expected number of cases, taken as the median of the numbers of cases during the same calendar week (eg, week 40) in the epidemic period, where i=1 (week 40 (2009)), 2 (week 41 (2009)),…, 26 (week 13 (2010)). The weekly endemic-epidemic index (EEI)16 17 for the ith week is given by
To obtain the corresponding 95% CI, we computed the variance of log(Oi/Ei) using the delta method,18 considering Oi and Ei as independent random variables. Specifically, we consider
We assume that Oi follows a Poisson distribution with E(Oi)=μi where
Example. To demonstrate the applicability of the proposed confidence interval, we compare it with an alternative approach that considers Ei not random quantities. In this case, we consider that Oi follows a Poisson distribution with E(Oi)=μi=λiEi.
To compare the two approaches, we use data for cases of influenza+influenza-related illnesses for the 12th week. In this case, X12·1=5766, X12·2=1851 and X12·3=4272 for the epidemic period and O12=3344 for the pandemic period. The resulting EEI12 is 0.78, which is based on an expected number of cases, E12, that is equal to the median of three observations in the epidemic period that range widely from 1851 to 5766. This large variation in the epidemic period is accounted for more appropriately with the delta method, which considers both Oi and Ei to be random, whereas the Poisson approach considers Ei to be fixed: the resulting 95% CI for EEI12 is appropriately wider when the former is compared to the latter. Specifically, the CIs obtained using the Poisson approach and the delta method were (0.76 to 0.81) and (0.29 to 2.08), respectively, and the statistical test at the 5% level would lead to opposite conclusions.
Supplementary materials
Web Only Data oem.2011.065003
Files in this Data Supplement:
Footnotes
Funding This study was partially funded by grants from the Fondo de Investigación Sanitaria (PT007), the Canadian Institutes for Health Research and the Institut Català d'Avaluacions Mèdiques.
Competing interests None.
Provenance and peer review Not commissioned; externally peer reviewed.