Article Text

Abstract
Objectives Few studies have assessed the effects of policies aimed to reduce traffic-related air pollution. The aims of this study were to evaluate the impact, in terms of air quality and health effects, of two low-emission zones established in Rome in the period 2001–2005 and to assess the impact by socioeconomic position (SEP) of the population.
Methods We evaluated the effects of the intervention on various stages in the full-chain model, that is, pressure (number and age distribution of cars), emissions, PM10 and NO2 concentrations, population exposure and years of life gained (YLG). The impact was evaluated according to a small-area indicator of SEP.
Results During the period 2001–2005, there was a decrease in the total number of cars (−3.8%), NO2 and PM10 emissions and concentrations (from 22.9 to 17.4 μg/m3 for NO2 and from 7.8 to 6.2 μg/m3 for PM10), and in the residents' exposure. In the two low-emission zones, there was an additional decrease in air pollution concentrations (NO2: −4.13 and −2.99 μg/m3; PM10: −0.70 and −0.47 μg/m3). As a result of the policy, 264 522 residents living along busy roads gained 3.4 days per person (921 YLG per 100 000) for NO2 reduction. The gain was larger for people in the highest SEP group (1387 YLG per 100 000) than for residents in the lowest SEP group (340 YLG per 100 000).
Conclusion The traffic policy in Rome was effective in reducing traffic-related air pollution, but most of the health gains were found in well-off residents.
- Air pollution
- health impact assessment
- mortality
- social class
Statistics from Altmetric.com
What this paper adds
Few studies have evaluated the impact of traffic policies on both air quality and health.
Policies affect the intervention zones, and reductions in NO2 are larger than those in PM10.
In Rome, the low-emission zoning had a small impact on years of life gained at the city level but had a large impact in the intervention area.
The high socioeconomic position population benefited more from the policy than low socioeconomic groups.
The low-emission zone in Rome was beneficial from a public health point of view for all socioeconomic groups of the population, but it also exacerbated social inequalities.
The literature on the detrimental effects of traffic air pollution on health has grown considerably in the last decade.1 Recently, the debate on the possible differential effects of air pollution exposure in different socioeconomic groups of the population has raised environmental justice concerns.2–4 In American and European cohort studies, educational level has been shown to modify the effect of exposure to particulate matter on mortality, with higher risks among people with lower educational level.5–11
According to the Italian Institute for Environmental Protection and Research, motorised road traffic is the source of 44% of the NO2 and 26% of the PM10 emissions in Italy.12 In the city of Rome, these percentages raise to 80% and 52%.13
The European Union has set standards for ambient air quality to protect the health of European citizens. National policies related to air quality are focused on economic instruments like fuel taxation and subsidies to replace old with new less-polluting vehicles. At the local level, traffic measures are being implemented like congestion charges, environmental zoning designed to limit traffic of polluting vehicles, monetary subsidies to accelerate replacement of old cars and measures to promote public transport and cycling.
Studies that have evaluated the effects of traffic policies are still limited; the majority of them indicate a decrease in emissions or concentrations of air pollutants, but only a few have analysed the effects on both air quality and health.14–21 The traffic congestion reduction during the 1996 Olympic Games in Atlanta was associated with a decreased traffic density, a reduction in ozone concentrations, lower rates in childhood asthma events and a small decrease in emergency department visits17 18; similar results were reported during the 2002 Summer Asian Games in South Korea.19 Using modelling and GIS data, Tonne et al.14 estimated a small reduction in NO2 and PM10 concentrations and a gain of 188 years of life per 100 000 people after the Congestion Charging Zone (CCZ) introduced in London in 2003. After the implementation of road pricing policy in Stockholm, there was a 8.5% decrease in NO2 emissions, a 13% decrease in PM10 emissions and a gain of 206 years of life per 100 000 people.20 Assuming the same concentration–response function (CRF) for low and high socioeconomic groups, the study conducted in London indicated that the congestion charging scheme was associated with a small reduction in socioeconomic inequalities in exposure to traffic-related air pollution and in mortality.14
The aims of this study were to evaluate the impact, in terms of air quality and health effects, of the intervention implemented by the City Council of Rome (two low-emission zones) in the period 2001–2005 to reduce traffic-related air pollution and to examine whether the impact was different by socioeconomic position (SEP). We evaluated the sensitivity of the results by the use of a single or SEP-specific CRFs.
Methods
This study was conducted within the INTARESE (Integrated Assessment of Health Risks of Environmental Stressors in Europe) project.22 Briefly, INTARESE uses a full-chain approach to assess the effects of policies on indicators of health. Policies are evaluated on the basis of mean population health gain and also on indicators of the social distribution of that gain. We evaluated the effects of policy intervention on various stages of the full-chain model, that is, pressures (number of cars, age distribution of cars, number of kilometre driven), emissions, PM10 and NO2 concentrations, population exposure to PM10 and NO2 by SEP of the residents and health effects.
The urban layout of Rome
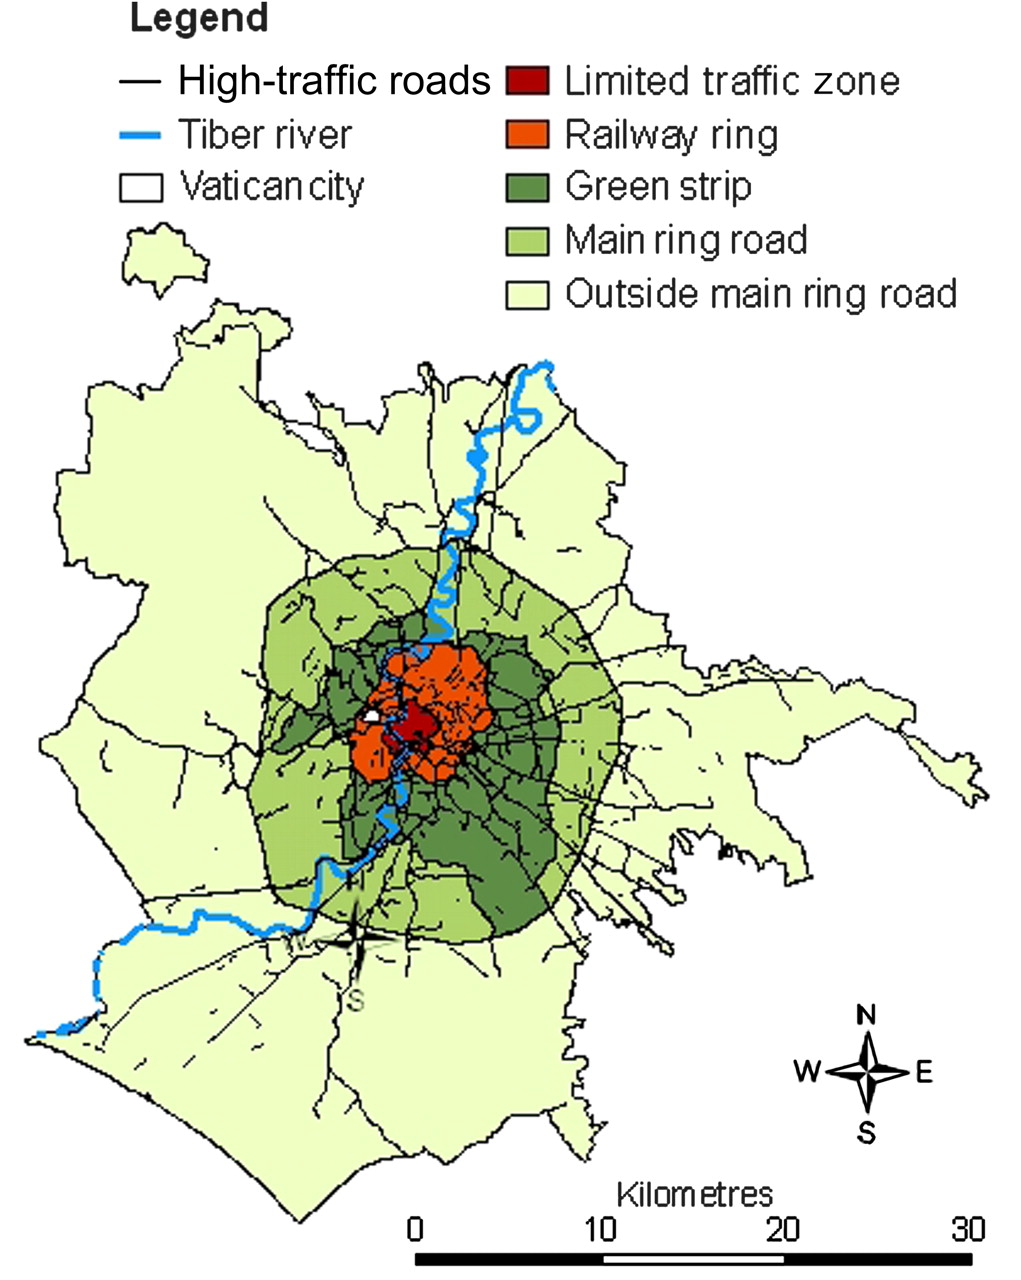
Rome is the largest Italian city, with 2.7 million inhabitants in a 1285 km2 area. The urban area is divided into five concentric circular zones, corresponding with different levels of urbanisation, population density and transportation. The historical centre, which corresponds to the limited traffic zone (LTZ) (55 000 inhabitants over an area of 6 km2), shows the highest concentration of business activity in Rome. The central railway ring area (397 000 inhabitants, 39 km2) has the highest population density and represents a great deal of business activity. The semi-central Green Strip area (944 000 inhabitants, 111 km2) is characterised by medium business density and high population density. The peripheral area covers the rest of the city that falls within the external ring road (Main Ring Road) (729 000 inhabitants, 189 km2). Business and residential density are lower than in the previous areas. The last area includes all the districts outside the main ring road (626 000 inhabitants). Unfortunately, the radial system of public transportation has not been sufficiently developed. In 2001, pedestrian and public transport shared only 40% (20% each) of the total mobility, while 60% of the trips were by private transport; in the historical centre, traffic is 34% pedestrian, 29% public transport and 37% private transport (including cars, motorcycles and mopeds). The map of Rome indicating the circular zones and high-traffic roads (HTRs) (>10 000 vehicles per day) is shown in figure 1.

Map of Rome with the circular zones and high-traffic roads (>10 000 vehicles per day).
The intervention
The intervention was implemented in two city areas: the central LTZ and the railway ring. Driving in the LTZ, since October 2001, has been prohibited to all vehicles from 06:30 till 18:00 from Monday through Friday and from 14:30 till 18:00 on Saturday. The system uses fully automatic checks with cameras that record vehicles that enter and exit the zone, with expensive fines automatically issued to those who enter illegally. Only authorised vehicles (residents' cars, commercial vehicles and public transport vehicles) can enter at any time.
In the railway ring area, the intervention was implemented between 2002 and 2003 and enforced using expensive fines. Starting in January 2002, old diesel vehicles were not allowed in the area (during the daytime); starting in July 2002, only vehicles with a catalytic converter were allowed in the area (during the daytime), and from January 2003 at any time of day.
The overall goal of the policy was to reduce the number of private vehicles in the centre, to encourage the use of public transport and to facilitate replacement of old heavily polluting vehicles. The intervention has been coupled with national policies to provide monetary incentives to buy new less-polluting vehicles.
Pressures
The impact of the policy on number and type of vehicles was evaluated using data from 2001 to 2005 derived from the national automobile association (http://www.aci.it). The data were of total number of vehicles by type (moped, motorcycles, cars, buses, light duty vehicles, heavy duty vehicles), type of fuel (gasoline, diesel, LPG or methane) and Euro classification categories (Euro 0, 1, 2, 3, 4) city-wide. The Euro classification category corresponds to the level of emissions of motor vehicles indicated by European directives.23 To evaluate whether these indicators changed because of the intervention or due to autonomous time trends, we have compared the Rome indicators with regional statistics (central Italy without Rome).
Policy evaluation
The evaluation of the policy was made by considering a diverse traffic composition in the area of intervention compared to the other areas of the city. This was done because the intervention prohibited access of the most pollutant vehicles to the low-emission zones. First, a ‘without policy scenario’ was considered on the basis of the known car fleet of the city, without taking into account the policy. Second, an ‘optimistic scenario’ was evaluated assuming that there would no longer be any Euro 0 cars in the railway ring area, all would be replaced with Euro 4 cars. Finally, a ‘pessimistic scenario’ was evaluated that considered 10% of the Euro 0 cars were still circulating within the railway ring area, and 90% of the Euro 0 cars in the target area were replaced by Euro 1–4 type cars (according to the proportion of the city car fleet in 2005).
Emissions
A software program (Copert III) developed for the European Environmental Agency was used for the calculation of emissions from the road transport sector.23 Air pollution emission factors were applied to all vehicles in circulation between 2001 and 2005 in order to determine average emission values for each year. For the year 2005, three sets of average fleet emission values were estimated: the without policy scenario emissions, the optimistic scenario emissions and the pessimistic scenario emissions. In appendix 1 (online only), we describe in detail the methods used to estimate these emission factors.
Concentration of air pollutants
Concentrations were calculated only for HTRs (>10 000 vehicles per day) using a local-scale dispersion model. We assumed that background concentrations were not affected by the policy. Emission factors, traffic volume and street geometry properties were used as input for the dispersion modelling of PM10 and NO2 at the street level with the CAR-2 model.24 25 The CAR-2 model assesses the contribution of traffic on a specific street for each pollutant. The model does not take nearby streets into account. The NO2 contribution is calculated from the NOx contribution, using the background ozone concentration and an empirical chemical conversion formula. To calculate the concentration contribution from road traffic, the CAR-2 model was applied to calculate the normalised concentration contribution, that is, the average concentration contribution per vehicle. It was then multiplied by the number of vehicles per day on a specific street in order to get the concentration contribution in micrograms per cubic metre, and it was calculated for 1560 distinct road characteristics (5 road types, 3 tree densities, 26 widths and 4 traffic compositions).
The City Council of Rome provided the traffic data for all major roads in Rome as of 2005 (6585 road segments, 26% of all roads in Rome), including the HTRs (2228 segments, 9.7% of all roads in Rome). For each HTR segment, we had data on the number of vehicles circulating, the circular zone and the neighbourhood in which it is located, the segment's width, length, the street type and tree density. More detailed methods are available in appendix 2 (online only).
We collected and stored all geographical variables using ArcGis 9.1 (ESRI, Redlands, California, USA). We used the Word Geodetic System of 1984 with the Universal Transverse Mercator 33N as the coordinate system and map projection (http://www.teleatlas.com).
Population exposures
Data on residents of Rome in 2001 and 2005 were obtained from the Municipal Registry Office. We geocoded each residential address using the Italian road network (Tele Atlas, Italy), and for each address, we measured the distance to the nearest HTR. We considered the 264 522 residents living at a distance of ≤50 m to the nearest HTR as the study population. We also assessed the exposure of the 1 077 460 subjects who live at a distance ≤150 m to the nearest HTR. For each subject, we assigned the exposure estimate to traffic-related PM10 and NO2 produced by the CAR-2 model.
As an index of SEP, a 5-level index by census block (average population: 500 subjects) was used.26 The study population was divided by the residential zones and by SEP.
CRFs for PM10 and NO2
We assumed a linear relationship between the air pollutants and associated health effects since most epidemiological studies on large populations have been unable to identify a threshold concentration below which ambient air pollutants have no effect on morbidity and mortality.27 CRFs were derived from cohort studies from both the USA and Europe.6 9 10 28–35 Estimates were derived from a meta-analysis with a fixed-effects inverse-variance weighted method.36 (See online table 1 for the individual studies.) Summary CRFs expressed per 10 μg/m3 for PM2.5 and NO2 were 1.06 (95% CI 1.03 to 1.09) and 1.06 (95% CI 1.04 to 1.08), respectively. As the policy affects tailpipe emissions only, which are in the fine particle mode, the change in PM10 modelled by the dispersion involves particles smaller than 2.5 μm. We therefore used the CRF for PM2.5 directly and multiplied that with the change in modelled PM10 (the model did not calculate PM2.5).
In addition, we calculated three different CRFs based on three educational levels (primary school, secondary school, and post secondary). The summary estimates were based on the original extended ACS study, the reanalysis of the six-city study and the Dutch cohort study (see online table 2).6 8 9 The summary CRFs expressed per 10 μg/m3 for PM2.5 were 1.10 (95% CI 1.05 to 1.16), 1.08 (95% CI 1.03 to 1.13) and 1.05 (95% CI 1.02 to 1.09) for low, average and high SEP categories, respectively. There were insufficient studies to derive SEP-specific CRFs for NO2.
Quantification of mortality impacts
The impact the traffic policies had on mortality in 2005 according to the optimistic and pessimistic scenarios were estimated in terms of years of life gained (YLG).37 We applied CRFs to all ≥30-year-old residents who live at a distance ≤50 m from HTRs. Baseline mortality rates by 1-year age groups of the Rome population were used. When the analysis was conducted by SEP, the SEP-specific mortality rates for Rome were considered. Population exposure to traffic-related PM10 and NO2 in 2001 and in 2005 (with and without application of the policy) was calculated by circular zone and SEP group. For the purpose of comparing circular zones and SEP groups, YLG were calculated per 100 000 people over 15 years following the implementation of the intervention (2006–2020).
Sensitivity analyses were conducted to evaluate the robustness of the results. First, we used different CRFs by SEP for PM10 exposure. Then, we considered not only the subjects living along the HTRs (for whom exposure assessment was more straightforward with the CAR-2 model) but also for the entire population who live at a distance of ≤150 m of an HTR. We estimated exposure to traffic-related PM10 and NO2 as follows:
For people living at a distance of ≤50 m of an HTR, we assigned the value exactly estimated with the CAR-2 model.
For people living at a distance between 50 and 100 m of an HTR, a factor of 0.7 was applied to the estimated contribution of the CAR-2 model. This was done based on experimental observations of the rapid decay of these pollutants from the source.2
For people living at a distance between 100 and 150 m of an HTR, a factor of 0.5 was applied to the estimated contribution of the CAR-2 model of the closest HTR.
Results
Traffic composition 2001–2005 in Rome
The total number of cars decreased slightly in Rome between 2001 and 2005 (−3.8%), but this was also observed in central Italy excluding Rome (−13.1%) and hence is likely not a result of the policy. The decrease of Euro 0 petrol cars and the increase of Euro 3 cars were substantially greater in Rome than in central Italy, which may be an effect of the policy or may reflect other differences between Rome and central Italy (online table 3).
Emission factors
We calculated emission factors by vehicle type and year according to the two scenarios (online table 4). In the Without policy scenario, the average emission factors for the fleet of public buses, heavy and light duty vehicles, mopeds, motorcycles and passenger cars decreased in Rome between 2001 and 2005, and the effect was stronger for NO2 (for cars: from 1.06 to 0.73 g/km) than for PM10 (for cars: from 0.079 to 0.067 g/km). As a result of the policy, under the optimistic scenario in 2005, there was a further reduction of the emission factors for passenger cars in the railway ring area (NO2: 0.45 g/km, −58%; PM10: 0.053 g/km; −33%).
Changes in concentrations
When emission factors were used in the CAR-2 model, the traffic-related contribution to PM10 and NO2 was estimated for each circular zone (Table 1). The traffic contribution to NO2 and PM10 decreased from 2001 to 2005 (without policy) by 24% and 21%, respectively. In 2005, there was an additional small reduction in the average concentration of NO2 (−2%) and PM10 (−1%) related to the intervention (both under the optimistic and pessimistic scenarios) across the city, assuming no changes outside the intervention area. The impact was sizeable when considering the intervention area, with a further 23% reduction in NO2 and 10% in PM10 in the railway ring area, under the optimistic scenario.
Modelled average traffic contribution along HTRs (>10 000 vehicles circulating per day) to the annual average of NO2 and PM10 concentrations (in micrograms per cubic metre) by circular zone in Rome
The difference between the two scenarios was slight. This was due to the large difference in Euro 0 emission factors compared to Euro 1–4. Therefore, the main impact on concentration contributions resulted from the removal of Euro 0 vehicles from the roads. The class of the replacement car was of lesser importance.
Changes in population exposure and related health effects
Table 2 shows the average population-weighted annual exposure to traffic-related NO2 and PM10 for 264 522 subjects living along HTRs and their impact in terms of YLG.
Changes in average population-weighted annual exposure to air pollution (NO2 and PM10, in micrograms per cubic metre) and associated impacts as YLG according to circular zone and SEP in subjects living along HTRs
Due to the changes in the car fleet, without taking account of the policy, the average exposure decreased from 2001 to 2005 (from 24.1 to 18.4 μg/m3 for NO2, and from 8.7 to 6.8 μg/m3 for PM10). This decrease affected much of the central part of the city (residents along an HTR outside the main ring road had a decrease of only 3.17 μg/m3 of exposure to NO2 compared to an average of 5.54 μg/m3 for residents in the city centre).
The intervention had an impact on the exposure of the residents in Rome living along HTRs: in the optimistic scenario for NO2, there was a further overall decrease of 0.78 μg/m3 due to an additional decrease of 3.27 and 4.02 μg/m3 in the railway ring and in the LTZ areas, respectively.
In Rome, 22% of residents along HTRs are also in a high SEP area, while only 14% are in a low SEP area. There were no differences between baseline concentrations in different socioeconomic groups, and the average NO2 exposure decreased from 2001 to 2005 by 5–6 μg/m3 in all groups. However, considering the policy, the highest NO2 difference was observed in the highest socioeconomic group (−1.21 μg/m3 vs −0.29 μg/m3 in the lowest socioeconomic group under the optimistic scenario).
All residents along HTRs were predicted to gain 2436 years, that is, 921 years of life per 100 000 (average gain per person: 3.4 days) from the optimistic scenario reduction in NO2, and 1812 years, that is, 685 years per 100 000 (average gain per person: 2.5 days) were gained from the pessimistic scenario. This gain was seen in the railway ring and LTZ areas (with 15 and 19 days per person, respectively). The highest socioeconomic group benefited most from the policy (1387 YLG vs 340 YLG per 100 000 in the optimistic scenario due to the reduction in NO2 exposure). For subjects living along an HTR, the optimistic and pessimistic reductions in PM10 exposure resulted in 153 YLG and 130 YLG per 100 000, respectively, substantially less than estimated for NO2, but consistently four times greater for the highest compared to the lowest socioeconomic group.
Table 3 shows the impacts of PM10 air pollution on YLG in Rome on the population living along an HTR by SEP using SEP-specific CRFs. The difference in the health gains seen in high and low SEP groups is smaller than that shown in table 2. The greatest gain was obtained by the two highest socioeconomic groups, but the social gradient of the effect was attenuated compared to the results we obtained using a single CRF.
Changes in average population-weighted annual exposure to air pollution (PM10) and associated impacts as YLG according to SEP in subjects living along HTR using SEP-specific CRFs
Table 4 shows the population-weighted exposure to traffic-related NO2 and PM10 for those living at a distance ≤150 m of HTRs. This illustrates the potential for additional health gains for a larger population living near (n=1 077 460) but not necessarily on an HTR (n=264 522). The gain in life expectancy was due to the reduction in the average population-weighted annual exposure in the LTZ and in the railway ring areas. These resulted in 686 YLG per 100 000 for NO2 reduction and 116 YLG per 100 000 for PM10 reduction in the population living at a distance of ≤150 m of an HTR. Considering the city as a whole, the gain was greater in the highest than in the lowest SEP group. Patterns observed with respect to zone and SEP were as observed for the HTR population.
Changes in average population weighted annual exposure to air pollution (NO2 and PM10, in micrograms per cubic metre) and associated impacts as YLG according to circular zone and SEP in residents within 150 m from HTRs
Discussion
The policy resulted in 33% and 58% lower PM10 and NO2 emissions from passenger cars in the intervention area. Changes in concentrations of NO2 and PM10 were modest city-wide (<1 μg/m3), but larger reductions were estimated in the intervention area. Predicted changes were larger for NO2 than for PM10, consistent with the known impact of traffic on this pollutant.13 14
Consistent with the modest change in air pollution concentrations, the policy resulted in small gains in life expectancy at the city level (3.4 days on average per person living at a distance of ≤50 m from HTR). Life expectancy gains were substantially larger when they were calculated for the population in the intervention area (19 and 15 days gained per resident in the LTZ and in the railway ring areas, respectively). Because of the geographical distribution of SEP within the city, the decrease in annual air pollution exposure was larger in the highest socioeconomic group. Despite higher baseline mortality rates in the lowest socioeconomic group, the gain in life expectancy was more substantial in the high socioeconomic groups. Socioeconomic differences were less marked in life expectancy gains when we used SEP-specific CRFs for PM10.
The small gain at the city level is very likely an underestimation of the true impact of the policy change. In fact with the modelling tools available, we only evaluated impacts of the policy on HTRs, assuming that there was no impact on urban background levels. Even though the impact on background conditions was probably very small, there are many people who are affected by background levels. Moreover, due to constraints in emission data, air pollution dispersion models and CRFs, we limited the assessment to NO2 and PM10. These pollutants are not the most specific indicators of the complex mixture of emissions from motorised traffic. The impact of the intervention on concentrations of ultrafine particles, soot and possible polycyclic aromatic hydrocarbons may have been more substantial. Furthermore, we only assessed impacts on residents and ignored potential benefits to commuters/traffic participants and people who work in the city.
Similar to this evaluation, the impact on NO2 concentrations was more substantial than on PM10 both in London14 and in Stockholm congestion charge intervention.20 There the impact was also largely restricted to the city centres: in London, the change in NO2 concentration was 0.73 in the CCZ versus 0.07 μg/m3 in Greater London, while in Stockholm, the decrease in NOx annual mean contribution to total level of NOx from traffic emissions was reduced by 10% in the centre and only by 5.3% in Greater Stockholm.
The estimated benefits in life years gained with the London congestion charging scheme were 183 YLG in 10 years per 100 000 residents of London's CCZ versus 26 YLG in 10 years per 100 000 in Greater London.14 Similarly, the benefits of road pricing in Stockholm were 206 YLG per 100 000 over 10 years.20 The choice we made to evaluate the policies only on subjects living along an HTR makes our figures much higher than in the above-mentioned studies.
In contrast to the Rome intervention, the CCZ policy in London was more beneficial for the most deprived, a result of a larger decrease in concentrations and larger baseline rates for the more deprived.14 This illustrates that the relationship between SEP and air pollution exposure is not simple. Available evidence from the USA and Canada, as well as from some European studies, have reported that persons with lower SEP in general are exposed to higher air pollution levels.2 On the contrary, in Rome, wealthy residents are more likely to live in the city centre, and they are exposed more than disadvantaged groups of the population are at their place of residence to higher air pollution concentrations.26 Because the policy targeted the central area of the city, the people who profited more from the policy were wealthy. In other European studies also the highest air pollution levels are reported for persons with the highest SEP.28 38
This study has some limitations. The long-term effect expressed in YLG reflects many assumptions.39 We assumed unchanging mortality rates and a consistent and stable change in pollutants' concentration over 15 years. Moreover, the changes in exposure to air pollution probably do not immediately affect mortality rates (we assumed a lag 0). We applied CRFs derived from studies conducted in different settings. Given the harmful effects of air pollution exposure, which are related to mortality and also include, for example, high incidence and prognosis of cardiovascular and respiratory diseases,1 the benefits of low-emission zones are probably much greater than those we found. Finally, given the similar PM10 and NO2 CRF coefficients and the greater decrease in NO2 than in PM10 we estimated, the impacts for the NO2 reduction were larger than those for PM. Although currently most health impact assessments in this area are based on PM, given the sensitivity of NOx to changes in traffic we would recommend using NOx together with PM for traffic-based evaluations (provided that double counting is excluded).
Conclusions
This study provides evidence that policies aimed at reducing traffic-related air pollution have beneficial effects: a decrease of emissions, of concentrations, of population exposure, and health gains. The socioeconomic distribution of these effects is not readily apparent and requires a thorough assessment in view of current concerns related to environmental justice.
Acknowledgments
The authors thank Margaret Becker for her editorial assistance.
References
Supplementary materials
Web Only Data oem.2010.063750
Files in this Data Supplement:
Footnotes
Funding This study was funded by the INTARESE project. INTARESE is a 5-year Integrated Project funded under the EU 6th Framework Programme—Priority 6.3 Global Change and Ecosystems (Contract No. 018385).
Competing interests None.
Provenance and peer review Not commissioned; externally peer reviewed.