Article Text

Abstract
Objective To investigate the association between Saharan dust outbreaks and natural, cardiovascular and respiratory mortality.
Methods A case–crossover design was adopted to assess the effects of Saharan dust days (SDD) on mortality in the Emilia-Romagna region of Italy. The population under study consisted of residents in the six main towns of the central-western part of the region who died between August 2002 and December 2006. The association of Saharan dust outbreaks and PM10 concentration with mortality was estimated using conditional logistic regression, adjusted for apparent temperature, holidays, summer population decrease, flu epidemic weeks and heat wave days. The role of the interaction term between PM10 and SDD was analysed to test for effect modification induced by SDD on the PM10-mortality concentration–response function. Separate estimates were undertaken for hot and cold seasons.
Results We found some evidence of increased respiratory mortality for people aged 75 or older on SDD. Respiratory mortality increased by 22.0% (95% CI 4.0% to 43.1%) on the SDD in the whole year model and by 33.9% (8.4% to 65.4%) in the hot season model. Effects substantially attenuated for natural and cardiovascular mortality with ORs of 1.042 (95% CI 0.992 to 1.095) and 1.043 (95% CI 0.969 to 1.122), respectively.
Conclusions Our findings suggest an association between respiratory mortality in the elderly and Saharan dust outbreaks. We found no evidence of an effect modification of dust events on the concentration–response relationship between PM10 and daily deaths. Further work should be carried out to clarify the mechanism of action.
- Saharan dust
- case crossover
- mortality
- particulate matter
- environment
- PM10-PM2.5-ultrafine
Statistics from Altmetric.com
Introduction
What this paper adds
Saharan dust outbreaks are quite frequent in southern Europe.
Evidence on the health effects of Saharan dust transport is lacking and the few epidemiological findings available are inconsistent.
Mortality data analysed for the first time in a recent study in Barcelona, showed increased effects of particulate matter on natural mortality on days affected by Saharan dust transport.
The study provides further evidence of the health effects of Saharan air masses by showing significantly increased respiratory mortality on Saharan dust days; much lower evidence was found for natural and cardiovascular mortality.
The analyses show Saharan dust outbreaks are an independent risk factor and not an effect modifier for the relationship between particulate matter and respiratory mortality.
Desert dust is one of the greatest sources of natural aerosols in the atmosphere, representing about 37% of the total (natural and anthropogenic) emission of atmospheric primary aerosols.1 Among the world's deserts, the Sahara is the strongest aeolian soil dust emitter, injecting 130–760 Mt/year.2 Dust particles rising in the free troposphere above North Africa can be transported over long distances by the atmospheric circulation, sometimes reaching the Near East and the Americas.2 A large amount of Saharan dust is exported over the Mediterranean basin towards southern Europe3 4 and, in some cases, central and northern Europe.5 Saharan events can also contribute to exceedances of the PM10 (particles with an aerodynamic diameter of ≤10 μm) daily European Union limit (and WHO guideline value) of 50 μg/m3.6
Saharan dust mobilisation has a great impact on the environment,3 7 climate variability1 and, perhaps, human health. A complete overview of reviewed studies on the health effects of Saharan dust can be found in Sandstrom and Forsberg8 and de Longueville et al.9 However, evidence on the health effects of Saharan dust transport is still lacking and the few epidemiological findings are inconsistent.
A previous study focused on paediatric asthma accident and emergency admissions in the Caribbean island of Trinidad,10 showing an increase in respiratory health effects in association with Saharan dust days (SDD). However, a subsequent study11 did not confirm these findings. An analysis of morbidity in Cyprus12 showed an increased risk of hospitalisation on Saharan dust storm days, particularly due to cardiovascular causes. However, the authors stated that inference from these associations was limited by the small number of dust storm days in the study period.
A recent study in Barcelona, Spain explored for the first time the effects of Saharan dust on mortality.13 The authors showed that unit increases in both fine and coarse particles were associated with greater increases in mortality on days affected by dust transport from the Sahara compared to other days. However, the study was based on a relatively short period of investigation (18 months), and the most significant association was close to the statistical significance limit (p for interaction between dust days and PM2.5–10=0.05). No other studies have been published based on mortality data. Recently, conflicting findings of studies on this issue have been presented at international conferences.14 15 In addition, studies focused on health effects related to dust of non-Saharan origin have not given consistent results.16–18
This study aimed at assessing the effects of SDD on mortality in Emilia-Romagna, a region in the Po basin of northern Italy (figure 1). In this vast flat area surrounded by mountains and often experiencing high levels of air pollution, Saharan dust episodes have been regularly monitored since 2002 at the Italian National Research Council (CNR) ‘O. Vittori’ background station on Monte Cimone (CMN), the highest peak in the northern Apennine mountains (2165 m above sea level). This station belongs to the Global Atmosphere Watch programme of the World Meteorological Organisation.

Saharan dust spreading to Emilia-Romagna as captured by the Moderate Resolution Imaging Spectroradiometer (MODIS) instrument on the NASA Aqua satellite. The boundaries of the Emilia-Romagna region and the location of the Monte Cimone station (CMN) are shown.
Methods
The specific objectives of the study were: (i) to investigate SDD effect modification on the particulate matter-mortality concentration–response function, and (ii) to assess the effects of SDD on natural, cardiovascular and respiratory mortality.
Exposure to particulate matter was expressed in term of particles with aerodynamic diameter ≤10 μm (PM10). Population exposure to Saharan dust transport was expressed in terms of a dichotomous variable classifying the study period in days affected (SDD) and not affected by Saharan dust transport (non-SDD).
Settings and data
The population under study consisted of residents in the six main towns (Piacenza, Parma, Reggio Emilia, Modena, Bologna and Ferrara) of the central-western part of the Emilia-Romagna region who died between August 2002 and December 2006. The towns in the eastern part of the region were excluded because of the possible confounding effect of marine dust and sea-salt on PM10. The total population of the study area was 1 119 200 (as of December 2006).
Individual mortality records were retrieved from the Regional Register of Causes of Deaths. Population data were provided by the Regional Statistical Office.
SDD were identified by analysing the hourly number concentration of coarse aerosol particles (geometric particle diameter (Dp) >1 μm), considered a marker of dust transport events from the Sahara desert.19 These measurements were carried out using a optical particle counter (model 1.109; Grimm, Ainring, Germany) following the experimental protocol described by Marinoni et al.19 The days characterised by coarse particle increases were identified by applying the Kolmogorov-Zurbenko filter to the time series of coarse particle daily mean values.4 In order to clearly deduce the Saharan origin of coarse particle peak events, 3D air mass back-trajectories from CMN were calculated using the FLEXTRA model.20 In order to corroborate the SDD identification, the classification procedure involves satellite data and Saharan dust transport modelling analyses (see Bonasoni et al4 for a detailed description of the procedure). Two different SDD definitions were used in epidemiological analyses. The first considered all SDDs regardless of the intensity (in terms of particle concentration) of the transport phenomenon. The second classification considered a subset of ‘strong’ SDDs characterised by coarse particle number concentrations higher than 0.25 particles/cm−3, that is, the 90th percentile of coarse particle distribution at CMN.
Population exposure to PM10, NO2 and O3 was estimated using data from the ISO 9001-certified fixed site monitoring network located within the selected urban areas; this network includes 11, 8 and 22 monitoring stations for PM10, O3 and NO2, respectively. Following the findings of a previous analysis,21 we averaged daily data over macro-areas. Missing data were imputed following the APHEA approach.22 Daily mean values of temperature and humidity were provided by the regional urban meteorological network. Apparent temperature,23 a composite index that takes into account air temperature and humidity, was computed to characterise bioclimatic conditions.
Design and statistical analysis
The epidemiological approach was based on a time-stratified case–crossover design which is an adaptation of the common retrospective case–control design. It was proposed by Maclure24 to study the effects of transient, intermittent exposures on the subsequent risk of rare acute-onset events in close temporal proximity to exposure. This approach compares exposures during the period of time of death (case period) with one or more periods when death did not occur (control periods). Each subject serves as their own control, providing the benefit that stable subject specific covariates such as genetic predisposition, smoking or other risk factors (indoor sources) cannot confound the effect estimates. Various sampling strategies were used to select control periods to estimate the effect of air pollution exposures on the health outcome of interest. Referent sampling schemes specific to air pollution epidemiology use reference periods both before and after the time of the event (bidirectional referent sampling) as a method to reduce bias due to temporal trends in exposure and outcome variables. In our study, control days were selected from the same day of the week, month and year as case days, following the time-stratified design which has been demonstrated to be the most appropriate for case–crossover studies of acute air pollution effects.13 25 26 The association of Saharan dust outbreaks and PM10 concentration with mortality was estimated using conditional logistic regression, adjusted for apparent temperature (lag 0), holidays, summer population decrease (7–22 August), flu epidemic weeks and heat wave days. An apparent temperature confounding effect was considered following the approach already adopted within an Italian country-wide study on the health effects of PM10.27 Heat wave days were defined as those days with mean apparent temperature above 30°C for at least the 2 preceding days. This definition is very similar to that adopted in the Barcelona study and it corresponds to the definition of the alert level of the regional heat warning system. Various lags have been tested for both PM10 and SDD variables. Influenza epidemics were defined on the basis of the weekly estimates of influenza incidence, as reported by the influenza surveillance system of the Italian National Institute of Health. This system is based on a nationwide sentinel surveillance network of general practitioners and paediatricians (INFLUNET). Flu epidemics weeks were defined as the weeks with regional incidence higher than two new well-diagnosed flu cases/week/1000 patients.
Basically, two models were applied to analyse the data. First we applied a model without insertion of the SDD variable. Then we applied a model including, in addition to PM10 and SDD as principal variables, an interaction term between them to test for effect modification induced by SDD on the PM10-mortality concentration–response function. Finally, PM10 and SDD were inserted in a model as independent variables, that is, without interaction.
Because of the higher risks associated with PM10 exposures during the hot season reported in several studies,28 29 separate estimates were undertaken for the period May–September (hot season) and October–April (cold season).
The statistical package R was used for the analyses.
Results
Eighty-two Saharan events (ie, consecutive days affected by Saharan dust transport) were identified in the study period, accounting for 16% of the total days with available SDD classification. Classification of dust events was available for 77% of the total days, with missing classifications much more frequent during the cold season. The frequency of dust days according to the more restrictive definition of SDD was 11%. This definition will be used in the presentation of results unless otherwise specified. The dust events showed a marked seasonal pattern, with 72% of the dust events occurring between April and September.
The annual PM10 average concentration in the study area was 41 μg/m3, with approximately 25% of days exceeding the EU limit. A brief description of PM10 distributions for the different time periods (whole year, cold and hot seasons) as well as for SDD and non-SDD is reported in table 1. Similar average concentrations were found for PM10 during the SDDs and non-SDDs even though higher particulate concentrations for the SDDs were found for the hot season. The Wilcoxon Mann–Whitney U test was applied to compare averages of PM10 concentrations on SDDs and non-SDDs. No significant differences were found for whole year and cold season averages. Significantly higher PM10 average concentrations on SDDs were found for hot season averages.
Summary statistics for PM10 mass concentration distributions (μg/m3) for Saharan and non-Saharan dust days
Our results focus on the elderly because, as expected,30 they were found to be at greater risk in relation to both PM10 and SDD. In particular, unless otherwise stated, the results are presented for people aged 75 or older to allow comparison with the Barcelona study.
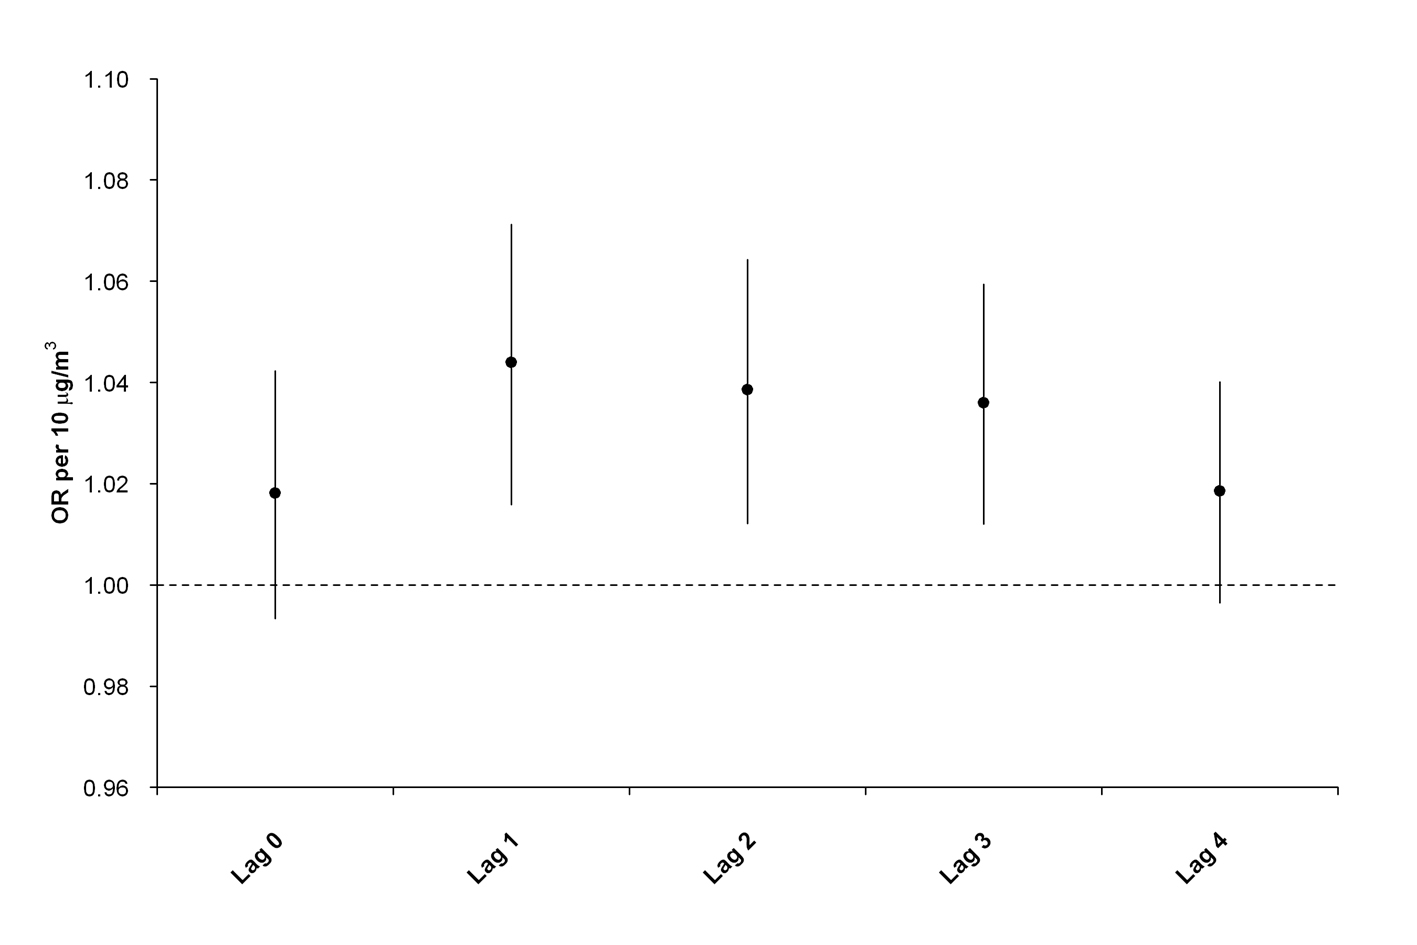
First we applied a model to assess the association between mortality and PM10 exposure without the insertion of the SDD variable. ORs were estimated for the same day (lag 0) to 4 days after exposure (lag 4). We found strongest effects at lag 1 and declining effects towards lag 4 (see online supplementary figure 1). The rise in natural mortality per 10 μg/m3 PM10 concentration increase (lag 1) was 0.4% (95% CI −0.2% to 1%) for the whole year model and 4.6% (95% CI 1.8% to 7.3%) for the hot season model. We also tested lag 1 and obtained similar results. On the other hand, applying the same model only to the days when dust classification was available raised the risk per 10 μg/m3 PM10 concentration increase to 0.7% (95% CI −0.1% to 1.6%). We did not find heterogeneity among towns (p for heterogeneity with regard to natural mortality=0.67).
Table 2 shows the findings of models including, in addition to SDD and PM10 as principal variables, the interaction term between them. No evidence of effect modification of SDD on the PM10–mortality relationship was found for any season or natural, cardiovascular or respiratory mortality (p value for interaction term>0.22).
OR and 95% CIs for the association of daily exposure to Saharan dust and PM10 with natural, cardiovascular and respiratory mortality for people aged 75 or above
Table 3 shows the results of the models with SDD and PM10 considered as independent variables. We tested various combinations of lags for both PM10 and SDD (from lag 0 to lag 3). The strongest associations were found at lag 1 for both variables even though SDD was significantly associated with respiratory effects up to lag 3 (see online supplementary figures 2 and 3). The mean difference in exposures between cases and controls was −0.4 μg/m3 for the whole year, −0.6 μg/m3 for the hot season and −0.2 μg/m3 for the cold season. The average number of deaths per day was similar during the SDDs (21.6, 9.8 and 2.1 for natural, cardiovascular and respiratory deaths, respectively) and non-SDDs (22.0, 10.1 and 2.1, respectively).
OR and 95% CIs for the association of daily exposure to Saharan dust and PM10 with natural, cardiovascular and respiratory mortality
An influence of dust outbreaks on mortality for all aggregated causes for both the whole year models and the hot season models was found. Dust effects were particularly evident for respiratory mortality, which increased by 22.0% (95% CI 4.0% to 43.1%) on the SDDs in the whole year model and by 33.9% (8.4% to 65.4%) in the hot season model. No additional risk was found during the cold season. The rise in natural mortality per 10 μg/m3 PM10 concentration increase was 0.8% (95% CI 0% to 1.6%) for the whole year model and 4% (95% CI 0.6% to 7.4%) for the hot season model.
Additional analyses were also carried out for other age groups. Models applied to people of all ages, those aged 65 or older and those aged 85 or older gave very similar results. Models applied to the <75-year-old age group confirmed a higher risk for respiratory mortality during dust days (table 3) even though the associations were not statistically significant and the confidence intervals were very large (OR 1.428 (95% CI 0.934 to 2.185) for the whole year model and 1.734 (95% CI 0.981 to 3.062) for the hot season model. Overall, no effect was found in this age group for cardiovascular and natural mortality.
Results were qualitatively similar using the broader definition of SDDs, even though the increase in mortality associated with dust events was generally lower (see online supplementary table 1). Particularly, compared to the most restrictive SDD definition, the ORs associated with SDD with respect to natural mortality decreased from 1.042 to 1.001 for the whole year model and from 1.050 to 1.014 for hot season model. Similar patterns were found for respiratory mortality with ORs decreasing from 1.222 to 1.126 for the whole year model and from 1.339 to 1.217 for the hot season model.
We conducted sensitivity analysis considering several alternative models that differed in their handling of the confounding effect of the apparent temperature and heat wave definitions. In addition, exclusion of the 2003 data (when prolonged heat waves affected Emilia-Romagna; see online supplementary table 2) and insertion in the models of the NO2 or O3 concentrations as confounders were tested. As a whole, we found only minor changes in the results (see online supplementary tables 3 and 4).
Discussion
Saharan dust transport events reaching the Emilia-Romagna region showed some associations with an increased risk of respiratory mortality for people aged 75 or older. Specifically, we found a significant increase in respiratory mortality for both whole year models and hot season models, while risks associated with PM10 exposure were similar to national31 and international estimates,30 32 and remained almost the same with the insertion of the SDD variable in the models. Much lower evidence of harmful effects of SDDs was found for natural and cardiovascular mortality.
Our results confirm those obtained in Barcelona suggesting a role of Saharan dust transport in increasing risk of death. However, unlike the Barcelona study, we found no evidence of the effect modification of dust events on the concentration–response relationship between PM10 and daily deaths. Instead, we found an independent relationship between Saharan dust transport and daily mortality. No mention of this direct relationship between SDD and mortality was made in the report of the Barcelona study. The high frequency of dust days described in the Barcelona study and in our study emphasises the importance of the health impact of Saharan dust transport.
The major strength of our study is that for the first time the effects of Saharan dust on different causes of mortality have been addressed. As expected,8 we found prominent respiratory effects.
We could not analyse the coarse and fine fractions individually, since no aerosol fine fraction monitoring was carried out in Emilia-Romagna during the investigated period. This is a potential weakness of the study as the use of an unspecific marker of Saharan dust could have affected the ability to detect an interaction between SDD occurrence and PM10 exposure. Nevertheless, the issue of harmful effects of Saharan dust should be addressed by taking PM10 data into account. As a matter of fact, the effect of dust on mortality in the Barcelona study was related both to fine and coarse fractions and an even higher impact of SDDs was found on fine fraction than coarse fraction concentrations. Moreover, Saharan dust data collected at CMN showed a significant contribution of particles with a diameter of less than 2.5 μm. In the MINATROC campaign, the fine fraction accounted for 99% of PM10 total particle number and 28% of total particles mass.19 In general, long distance transport reduces the amount of heavier and larger particles in Saharan air masses, thus increasing the relative contribution of smaller particles. In fact, previous studies of African dust size distributions over the western Atlantic showed that approximately one-third to one-half of the dust mass consisted of particles less than 2.0–2.5 μm in aerodynamic diameter.33 These data show that PM2.5–10 (ie, the usual definition of coarse fraction adopted in air pollution monitoring and in epidemiological studies) should be adopted with caution as a specific marker of Saharan dust transports, which are probably better described by PM1.0–10.
Even though concentrations of particulate matter during dust events would be lower without a Saharan dust contribution to the total mass,6 levels of particulate matter are expected to be nearly equal or even lower during dust days in comparison with all other days. In fact, this was found in our analyses and in the Barcelona study, that is, in areas where other sources of particulate matter together with synoptic meteorological conditions produce larger impacts on particulate matter concentrations. Also the mean levels of particulate matter were similar in our and the Barcelona data: average Barcelona concentrations were 40 μg/m3 (24.9 μg/m3 and 15.1 μg/m3 for PM2.5 and PM2.5–10, respectively), while we found average PM10 values equal to 41 μg/m3. Impacts of dust episodes on particulate matter concentrations were evident for other areas such as the Caribbean and Cyprus, where dramatic increases in PM10 concentrations were found during dust episodes. In Cyprus mean PM10 levels of about 55 μg/m3 increase by several hundreds of μg/m3 during dust episodes. Similar dramatic increases were found in Trinidad where PM10 values were recorded in the range of 136–150 μg/m3 during dust days compared with concentrations of 30–40 μg/m3 on non-SDD.34
A weakness of our study is the lack of data on chemical and biological components. In fact, the mechanism by which mortality increases were induced remains unclear and further work is needed to identify the mechanism of action and to strengthen epidemiological findings. The spectrum of hypotheses is quite broad. Saharan dust could affect human health because of specific chemical components or possibly through biogenic factors. In fact, a number of studies35–38 have shown how bacteria, fungi and viruses can be transported long distances in Saharan air masses as active biogenic agents.39 As reported by Kellogg and Griffin,36 previous work investigating African dust on Barbados suggested that numbers or types of microbes may correlate with asthma incidence more clearly than total dust concentration. This could partially explain our results indicating an increase in respiratory mortality on days affected by Saharan dust transport but without any significant increase in PM10 exposure. Moreover, it should be noted that studies conducted in sub-Saharan Africa suggested that dust may favour meningitis epidemics by damaging the epithelial cells lining the nose and throat permitting easy passage of the bacteria into the blood stream.40 The lack of significant effect during the cold season found in our study could indicate that the activity of biological agents in Saharan air masses differs depending on the season and the environmental conditions experienced by air masses travelling from the Sahara to Europe. Moreover, it can also be argued that the found seasonal dependency also could be related to the seasonal variations characterising the synoptic transport of Saharan dust towards northern Italy, both in terms of source basin and transport pathway.6 41 However, an interaction with other environmental factors not included in the analysis is another possible explanation.
Improving the chemical and biological characterisation of dust episodes within urban areas is needed to determine the mechanisms by which dust air masses affect mortality. However, it may be wiser to collect more epidemiological evidence before implementing such costly studies.
Acknowledgments
We would like to thank Michelle B Hanson for providing helpful comments on this manuscript.
References
Supplementary materials
Web Only Data oem.2010.058156
Files in this Data Supplement:
Footnotes
See Commentary, p 389
Competing interests None.
Provenance and peer review Not commissioned; externally peer reviewed.