Article Text

Abstract
Objectives: Both the public perceptions, and most published epidemiologic studies, rely on the assumption that the distance of a particular residence from a base station or a broadcast transmitter is an appropriate surrogate for exposure to radiofrequency fields, although complex propagation characteristics affect the beams from antennas. The main goal of this study was to characterise the distribution of residential exposure from antennas using personal exposure meters.
Methods: A total of 200 randomly selected people were enrolled. Each participant was supplied with a personal exposure meter for 24 h measurements, and kept a time–location–activity diary. Two exposure metrics for each radiofrequency were then calculated: the proportion of measurements above the detection limit (0.05 V/m), and the maximum electric field strength. Residential address was geocoded, and distance from each antenna was calculated.
Results: Much of the time, the recorded field strength was below the detection level (0.05 V/m), the FM band standing apart with a proportion above the detection threshold of 12.3%. The maximum electric field strength was always lower than 1.5 V/m. Exposure to GSM and DCS waves peaked around 280 m and 1000 m from the antennas. A downward trend was found within a 10 km range for FM. Conversely, UMTS, TV 3, and TV 4&5 signals did not vary with distance.
Conclusions: Despite numerous limiting factors entailing a high variability in radiofrequency exposure assessment, but owing to a sound statistical technique, we found that exposures from GSM and DCS base stations increase with distance in the near source zone, to a maximum where the main beam intersects the ground. We believe these results will contribute to the ongoing public debate over the location of base stations and their associated emissions.
Statistics from Altmetric.com
Main messages
Personal exposure to radiofrequencies was assessed in a sample representative of the general population, while distinguishing between the exposure from different mobile phone base stations and broadcast transmitters.
The higher proportion of measurements above the detection limit (0.05 V/m) was found for the FM band (12.3%).
Two distinct peaks were observed for global system for communication exposure distribution with distance from the nearest base station: one around 280 m, mainly in urban areas; the other one around 1000 m, mainly in periurban areas.
Degree of urbanisation is an important parameter to consider in the assessment of radiofrequency exposure from base stations and FM transmitters.
People are exposed to many sources of radiofrequency (RF) electromagnetic fields including radio and TV transmitters, telecommunications links and satellite communication as well as mobile phones and their supporting transmitters. TV transmitters operate at relatively high power levels up to about 1 MW (to cover as much area as possible), but are not located in heavily populated areas. Cellular wireless technology relies on an extensive network of low-power transmitters (or base stations) that communicate with users’ handsets. Base stations are ubiquitous in populated areas to maintain quality and avoid congestion increases, but they are less numerous in lower-demand areas.1
There is a long history of public concern and resistance to the location of transmitters, for reasons involving aesthetics and property values, as well as health concerns. Although the RF levels produced by broadcast transmitters and base stations are much lower than those from use of the phone handset, the more continuous exposure from antennas has produced a greater public concern.2 The primary concern has been with cancer risk among populations who live in proximity to broadcast transmitters, although effects on wellbeing are also frequently raised. Much of the research has been conducted in response to such concerns, but the results have been inconclusive.1 3
Because RFs are invisible and imperceptible, individuals cannot directly report on their exposure. Both the public perceptions, and most published epidemiologic studies, therefore rely on the assumption that the distance of a particular residence from the base station mast is an appropriate surrogate for exposure to RF fields.1 Doubtless power density in the RF beam decreases with increasing distance. However, the relation between exposure and distance from the antenna is usually very complex, especially in urban areas: (1) because of the narrow vertical spread of the beam, the RF field strength at the ground directly below the antenna is low; (2) as one moves away, the field pattern can be complicated, with peaks and valleys in field strength with increasing distance from the antenna, in relation to the phasing in the near-source zone and the scattering attenuation and reflection of the signal due to intervening buildings4; and (3) the propagation of fields to locations in homes is affected markedly by local perturbation. The power density levels inside a building can be from 1 to 100 times lower than outside, depending on the type of building construction.5 In addition, exposure can vary substantially within the building. For example, exposure was found to be about twice as high in the upper compared with the lower floors of a building,6 and to vary up to two orders of magnitude within restricted areas (about 1 m3).7 (4) RF exposures arise from a wide variety of sources (including other base stations and transmitters).3
There have been limited efforts to characterise population exposures.8 9 Many of the measurements reported so far were spot measurements that are unlikely to be a good indicator of exposure over time in the light of time-dependent signal variability and of the movements in space that characterise most human activities. An alternative approach, although limited to outdoor conditions, is theoretical prediction. Ha et al and Merzenich et al have developed field strength prediction programmes for assessment of individual exposure from AM radio or TV transmitters.10 11 Regarding mobile base stations, much more complex models have been developed to predict field strength at a given location on the basis of the position of the base station, the maximum power load, antenna characteristics, topography, shielding effects of house walls, etc. However, they require additional validation studies before they can be applied for epidemiological research.5 12
Estimation of community exposure to RFs from transmitters is, however, amenable to refinement. Two commercial personal exposure meters (PEM) have recently been developed (the EME SPY 120 made by Satimo, Brest, France; and the ESM 140 made by Maschek, Bad Wörishofen, Germany). They offer a way forward for direct exposure assessment of individuals over time and space.13–20
The goals of this study, using such a PEM, are to characterise the distribution of residential exposure from antennas and transmitters, to assess how exposure to RF fields varies with distance from these point sources, and to test the association of RF exposure with the level of urbanisation of the area.
METHODS
Study population
This study took place in the Department of Doubs (485 000 inhabitants) located in eastern France. We carried out a stratified sampling, dividing the study population in urban, periurban, and rural subgroups, according to the place of residence. French strict privacy protection laws impede any access to population census lists. We took therefore a simple random sample from the Besançon (capital of the department) municipality staff list, for urban, and periurban subgroups. For the rural subgroup we randomly sampled from the Agricultural Health Insurance plan rolls. A total of 200 people was enrolled into the study (urban: 50, periurban: 100, rural: 50), between December 2005 and September 2006. To minimise the temporal variability in RF transmissions, PEMs were deployed on weekdays. The choice of the day was not systematic but depended on participants’ and PEMs’ availability. All participants gave written informed consent.
Questionnaires
Data collection and RF monitoring were overseen by two trained interviewers. On acceptance of participation, an appointment was made for a visit. Questionnaires were presented along with instructions. Data on individual, house, and workplace characteristics, as well as activities that might influence RF exposure were gathered at the beginning of the study. All participants kept a time–location–activity diary, in which they noted their location and activities every 15 minutes for a period of 24 h. Data were subsequently entered into a computer by the interviewers.
Personal exposure meter
To estimate the dose, time pattern, and frequencies of exposure from all key sources for each individual, the EME SPY 120 was preferred to the ESM 140 that does not measure FM and TV frequencies, and presents a limited selectivity to differentiate between the frequency bands.14 18 19 The EME SPY 120 records the electric field strength present in 12 different bands at regular intervals, with a 0.05 V/m lower detection threshold and a 5 V/m upper recording threshold. For the purpose of this study, we focused on the FM, TV 3, TV 4&5, and the received radio signals (Rx) from the point of view of a mobile phone, GSM Rx, DCS Rx, and UMTS Rx frequency bands. Because of its memory capacity, each device was configured for a 13-second measurement period with a data collection period of 24 h, potentially yielding 6643 data points. Each record corresponds to the minimum value from sequences of 20 samples taken from the detectors each 330 μs.
The participants were supplied with the PEM and a bag that could be used either around the waist or over the shoulder. In the course of the measurement day, they were asked to perform their routine tasks while wearing the PEM. At night, they were asked to place the PEM next to their bed.
Transmitters and base stations
A database giving details (location, height, dates of emission, type of transmission, RF band range) for all antennas located in the Department of Doubs, was supplied by the French Radiofrequency Agency. We extracted FM antennas, TV transmitters, and mobile phone base stations, and cross-checked the list obtained with data on the Cartoradio website.21 We identified 15 FM transmitters, 1 TV 3 transmitter, 3 TV 4&5 transmitters, 95 GSM base stations, 84 DCS base stations, and 73 UMTS base stations on the air during the study period. At the time of the study, 61 villages (out of 594 composing the Department of Doubs), all rural, were not served by base stations. Residential address was geocoded, and distance from each antenna was calculated based on the coordinates of the residence location and the antenna locations.
Exposure assessment
Each time–location–activity diary was used to identify the time periods spent at home, and extract the measurements recorded at the place of residence. If participants spent several time periods at home during the measurement day, the corresponding data were merged in the same individual record.
Because there is no known biological mechanism by which RF can increase the risk of health endpoints, the relevant exposure metric is unknown. Two simple exposure metrics were defined for each participant and each RF: the proportion of measurements above the detection limit (reflecting total RF exposure, and hereafter called “detectable” exposure), and the maximum value of all measurements (characterising the peak RF exposure to be compared with exposure guidelines, and hereafter called “maximum” exposure).
Statistical analysis
We performed analyses in terms of field strength (E), with measurements expressed as V/m. This metric is mathematically related to power density (S, expressed as W/m2) according to the formula: S = E2/377.
Ignoring the exact shape of the recorded exposure versus distance relations, no statistical test was planned at this stage. Rather, data were fitted with cubic smoothing P splines, with 10 degrees of freedom, using a logarithm scale for distance. We focused on the shape of the curve over the 0–1000 m range for GSM, DCS, and UMTS, and the 0–30 000 m range for FM, TV 3, TV 4&5.
We performed non-parametric Kruskal–Wallis tests to compare exposures across urban, periurban and rural areas, expecting a decreasing trend in RF exposure in relation to base station density.
All data were analysed using R statistical software (stats and pspline packages).22
Ethics
Ethical clearance for this study was granted by the French National Commission for the Confidentiality of Computerized Data (no 1104049).
RESULTS
Although the logged data points were initially inspected for corrupt records, deeper quality controls on the whole dataset indicated full or partial PEM failure for 15 participants. One more subject was excluded (no time spent at home during the 24 h period), leaving 184 subjects for analyses (45, 92, 47, in urban, periurban and rural areas, respectively). On average, participants spent 14 h 58 minutes (standard deviation: 3 h 36 minutes) at home during the recording day, corresponding to a mean number of 4140.88 records per participant.
Correlation coefficients between detectable and maximum exposures range from 0.34 (TV 3 band) to 0.54 (TV 4&5 band).
Table 1 shows that much of the time the recorded field strength is below the detection level, the FM band is standing apart with a (still low) mean proportion above the detection threshold of 12.3%. At the right end of the distribution, few participants exhibit high proportions (⩾80%) of exceedances for GSM, DCS, or TV 4&5 bands (n = 4, 2, 2, respectively), but they are more numerous (n = 20) for the FM band. The maximum electric field strengths, all below 1.5 V/m (and therefore, below the upper recording threshold), are between 20 and 400 times lower than the International Commission on Non-Ionizing Radiation Protection (ICNIRP) reference level (ranging from 28 V/m for FM and TV 3 bands, to 61 V/m for UMTS band).23
Figure 1 shows that exposures vary greatly, even at similar distances from GSM and DCS base stations (the greatest differences appearing in the short range, ie, in urban and periurban areas). Heterogeneity is more pronounced with maximum field strengths. Two distinct peaks are observed for the GSM detectable exposure distribution with distance: one around 280 m, mainly in urban areas; the other one, around 1000 m, mainly in periurban areas. Maximum exposure shows rather a slightly decreasing trend with distance. DCS exposure distribution is similar to the GSM’s one, although much less contrasted for the detectable exposure. UMTS curves, in contrast, appear flat.
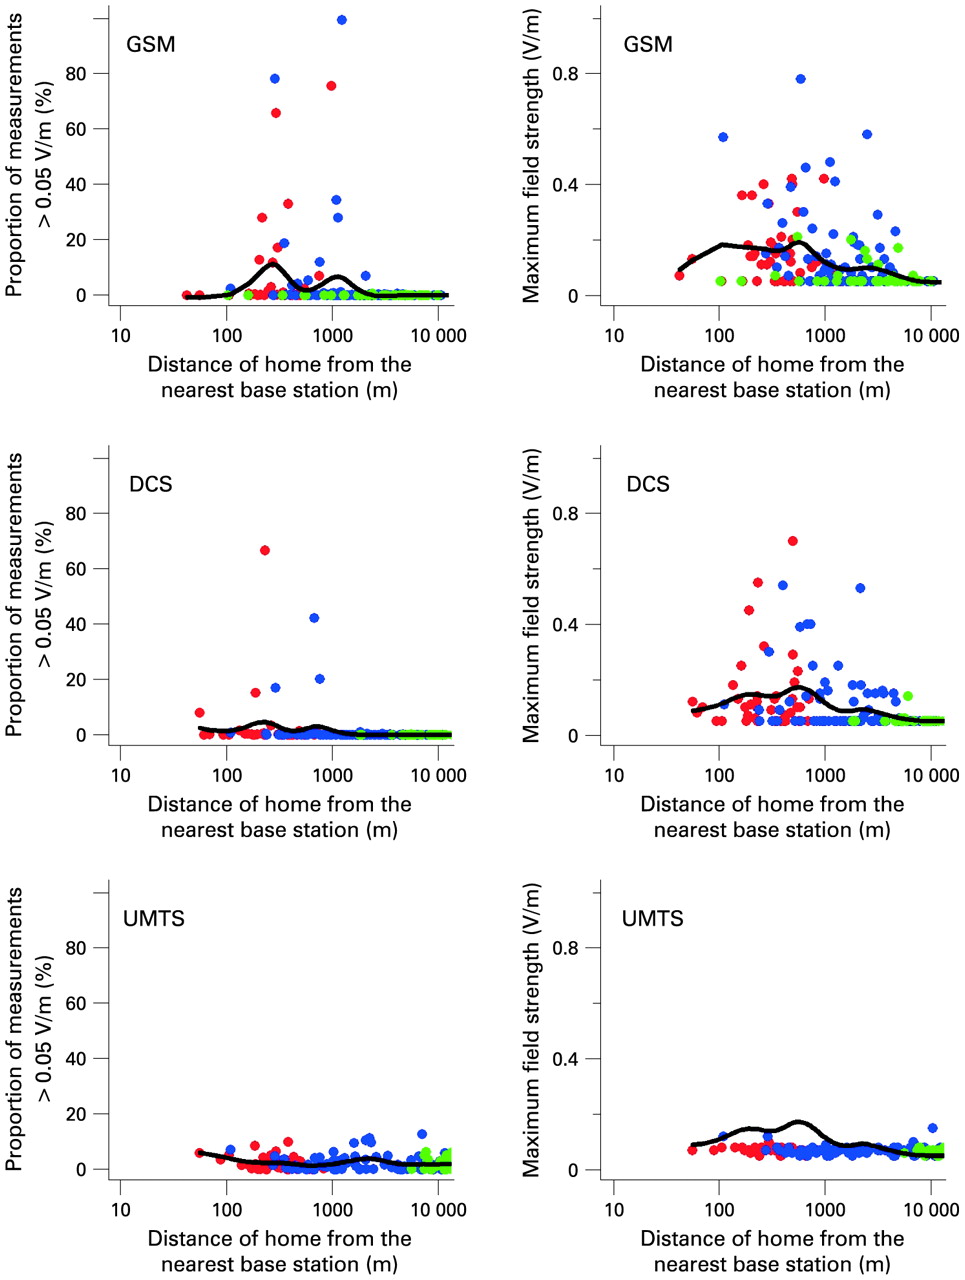
Relationships and cubic smoothing P splines between distance of home from the nearest base station and recorded exposures (red dots indicate urban areas; blue dots, periurban areas; green dots, rural areas). DCS, digital communication system; GSM, global system for mobile communications; UMTS, universal mobile telecommunication system.
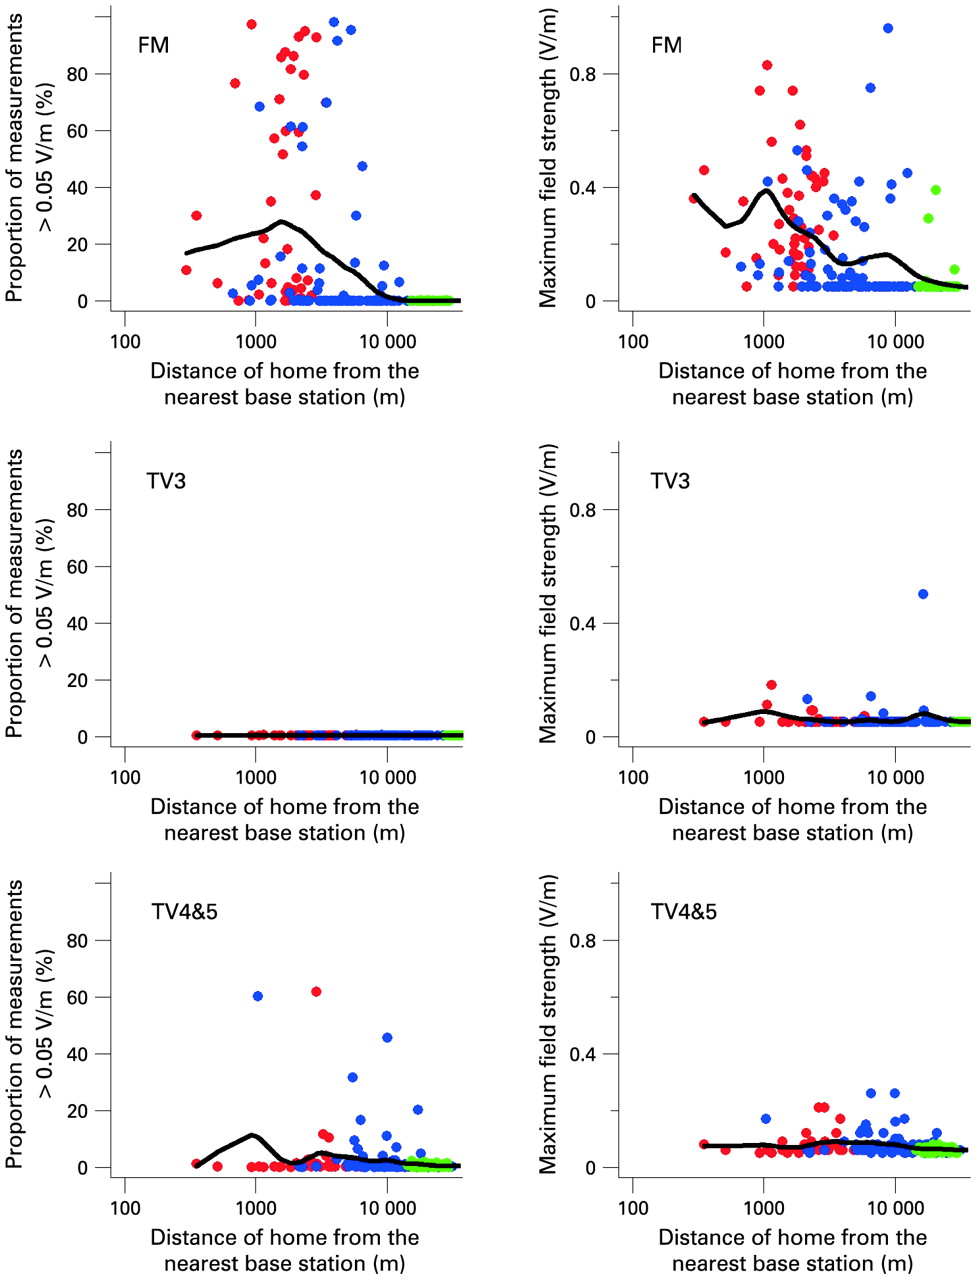
Exposure to FM waves exhibits a short plateau, followed by a declining trend with distance within the 1.5–10 km range (fig 2). Conversely, TV signals show no trend with distance.

Relationships and cubic smoothing P splines between distance of home from the nearest transmitter and recorded exposures (red dots indicate urban areas; blue dots, periurban areas; green dots, rural areas). One measurement for the FM band, equal to 1.43 V/m, is not represented.
Regarding RF exposures across areas (urban, periurban, and rural), only a few results did not reach statistical significance (UMTS for both exposure variables, and TV 4&5 for the detectable exposure) (table 2). In all other cases, a decreasing trend (from urban to rural areas) was found, although TV3 results appear meaningless due to the very low exposures characterised by null estimates at the second decimal place.
DISCUSSION
The main contribution of this study is to assess personal exposure (and not ambient field strengths), while distinguishing between the exposure from different RF point sources, in a sample representative of the general population. By restricting the assessment to places where individuals spend much of their time (residence location), distances to antennas could be calculated. Moreover, wearing their PEM, participants could move around (indoors and outdoors) allowing real-life exposure assessment at home.
Questionnaire
Time-location analyses relied on diaries, which we considered adequate for place of residence (despite some misclassification due to the 15-minute time cell), but not for workplace (because of complexity raised by multi-site occupations). Only residential exposure was therefore assessed in this study. As completing the diary was regarded as a burden by several participants, some imprecision (due to transcription error, lack of motivation, etc) must be envisaged. An approximate residential address would induce some inaccuracy in geocoding, and then in distance calculation, and some vagueness in time periods spent at home would add uncertainty to the recorded exposure metrics. However, both errors would result in a non-differential misclassification.
Personal exposure meter
Whatever the PEM, some possible pitfalls when used in epidemiological field studies must be envisaged: influence of the direction of the probe when the PEM is not worn on the body, polarisation of the incident waves, isolation, etc.24
Despite these possible sources of error, the tamper-proof EME SPY 120 represented a key tool for assessing actual time-averaged exposure from RFs. However, it revealed itself to be a fragile item in real-life conditions, with secondary weld failures for two PEMs, probably due to mechanical shocks. Unfortunately, electrical shortings between inside antennas resulted in falsely detectable signals when downloading the data. Only secondary careful statistical analyses highlighted this malfunctioning, obliging us to discard the data from 15 participants.
According to the manufacturer, the EME SPY 120 measures field strengths with a tolerance, ranging from 0.5 dB (−6% to +6%) (FM), to 2.5 dB (−25% to +33%) (DCS). This margin of error may appear broad in environmental epidemiology, but is considered acceptable in the RF field.13
Laboratory investigations have shown important shortcomings in this instrument’s performance.13 First, one combination of signals in different bands showed a significant change between single signal and simultaneous signal results. Indeed, recorded field strength of signals in the TV 4&5 were significantly reduced, by about one-third, in the presence of a GSM signal. Second, the PEM did not sum together properly the fields of multiple signals in the same band, under-reading by about one-third. This is a situation that occurs in practice particularly with broadcast (FM, TV 4&5) signals, and with multioperator cellular sites. Third, an inaccurate calibration was observed for UMTS base station signals, with recorded field errors of about - 6dB (−50%). Fourth, some spurious recording events (such as the isolated maximum field strength observed for the TV 3 band in our study, fig 2) also occurred. These shortcomings may have induced some bias in our study, mainly in urban areas, in relation to the density of antennas in the same band or in different bands.
Exposure assessment
Beside some possible PEMs’ technical limitations, the presence of the human body itself alters the field distribution in its immediate proximity. Readings vary with the location and position of the PEM on the body surface with respect to the direction of the source. This body influence results in an attenuation that can reach a maximum of 30 dB.25 Fortunately, the movement of people over time and the simultaneous contributions of various sources cause any error in time-averaged exposures to be much less important in a realistic field situation, individual dosimetry accounting for people’s mobility.14 On a population basis, this uncertainty may be non-differential. However, for any one individual, part of this uncertainty may be systematic, depending on the body shape and the usual environment.
We have not differentiated indoor from outdoor exposures. This contrast may explain some variability in the measurements, since the emissions strongly depend on the spatial orientation of the windows.26 Moreover, objects in the light of sight such as buildings and vegetation, as well as walls in indoor areas have an attenuation effect by orders of magnitude.11 27
No measure of central tendency was calculated because of the recording thresholds. We could have developed numerical approaches by fitting an assumed distribution to those data values that were above the detection threshold, generated data values at random according to the fitted distribution to replace the “censored” values, and evaluated the arithmetic mean of all the data. However, the scarcity of data above the detection threshold would have yielded doubtful and unreliable results. Thus, we used two simpler metrics. Although appropriate for comparison with reference levels, maximum values are liable to vary greatly between similar investigations. We are therefore more inclined to base our conclusions on the proportion of measurements above the detection threshold.
Transmitters and base stations
Network operators compile and supply information on transmitters and base stations to the French Radiofrequency Agency. However, the agency does not ensure the completeness and uptodateness of the resulting database. Although we have carefully cross-checked the antenna list provided by the French Radiofrequency Agency (identifying one more TV 4&5 transmitter, and five more UMTS base stations from the Cartoradio website),21 we may have missed some antennas, yielding overestimated distance to the nearest antenna in these areas.
Exposure metrics
Exposure metrics are subject to some degree of uncertainty, the greatest differences appearing in residences closest to the base stations. In addition to the previously mentioned limitations of the diary and the PEM, this illustrates the effect of the local environment through physical processes such as reflection, diffraction, and mutual interference of signal elements travelling through multiple, different paths,4 13 and the time-dependent call traffic.
Table 3 compares exposure metrics obtained in this study with those derived from two other studies having also used the EME SPY 120.15 16 With one exception (mean maximum exposure for FM band), our results are always the lowest. One must keep in mind that these previous studies have included volunteers living in urban areas. Our sampling procedure (random population sample, including people living in rural areas) may explain, at least partly, these differences.
The higher proportion of measurements above the detection limit is found for the FM band. This is to be related to low-power transmitters serving small towns and neighbourhoods of the capital of the department. The weak recorded field strengths for UMTS may be attributable to the lower power and the much narrower vertical main lobe of UMTS antennas, compared with GSM and DCS antennas.27 In all cases, maximum field strengths are far from ICNIRP reference levels, and still below stringent guidelines (such as the “Paris Charter”: 2 V/m, 24 h average, indoors).
This study highlights a bimodal distribution for exposure from GSM and DCS base stations with distance. This may be attributable to two different types of base stations. Microcellular base stations, more numerous in urban areas, have their antennas mounted a few metres above ground level as communications are only carried out over distances of a few hundred metres. This can explain the maximum ground level observed around 280 m away from the antenna. Conversely, macrocellular base stations are more frequently encountered in periurban areas. Their antennas are generally placed higher, between 15 and 50 m above ground level, to provide communications over distances of several kilometres, provoking a maximum ground level further from the antenna (around 1000 m in this study). Regarding UMTS band, the observed flat curve is in line with results reported by Bornkessel et al who found that distance in outdoors scenarios is not suited as a measure to quantify the UMTS exposure.27
A decreasing trend with distance is found for FM band, in the 0–10 km range, though also affected by a high variability. This suggests that changes in broadcasting patterns, and different time activity patterns (inside/outside home) may play a role. Broadcast towers transmit signals projected away from the tower almost horizontally to cover as much area as possible.1 Travelling in a straight line, they induce uniform field distributions, except in their immediate vicinity (where the vertical radiation patterns give rise to high variability in the fields measured near ground level).9 This uniform field strength is reflected by TV 3 and TV 4&5 flat P splines.
Rural areas represent sparsely populated zones, serviced by lower base-station densities, yielding smaller RF exposures (figs 1 and 2). In some way, the “area” categorical variable results from the transformation of the “distance” quantitative variable through splitting into three classes, since larger distances are observed, on average, between base stations in rural areas than urban areas (and larger distances are therefore observed between places of residence and base station locations). We confirmed in a distribution-free approach, that a decreasing trend across urban, periurban, and rural areas is noticeable for FM, GSM, and DCS bands. This result is in line with findings from Belgium, where for 28 different realistic exposure scenarios, exposure in rural areas is generally lower than in urban areas.17
As the debate regarding the health implications of exposure to non-ionising radiation continues, an increased effort must be made to evaluate factors that predict exposure to RF fields. Despite numerous limiting factors entailing a high variability in RF exposure assessment, but owing to a sound statistical technique, we found what theory implies. Exposures from GSM and DCS base stations increase with distance in the near source zone, to a maximum where the main beam intersects the ground. We believe that this research meets the need for more information to be made available to both local authorities and members of the public about the location of base stations and their associated emissions.
Acknowledgments
The authors thank Dr René de Seze for his insights and counsel on issues related to radiofrequencies, Dr Frédéric Mauny for his early guidance on the project, and Ghislaine Lantz for data collection and processing.
REFERENCES
Footnotes
Funding: This work was supported by the French Agency for Environmental and Occupational Health Safety (grant PC-ERF-2005-002).
Competing interests: None.
Ethics approval: Ethical clearance for this study was granted by the French National Commission for the Confidentiality of Computerized Data (no. 1104049).
Patient consent: Obtained.