Article Text

Abstract
Objectives: To study the association between short-term exposure to ultrafine particles and morbidity in Copenhagen, Denmark.
Methods: We studied the association between urban background levels of the total number concentration of particles (NCtot, 6–700 nm in diameter) measured at a single site (15 May 2001 to 31 December 2004) and hospital admissions due to cardiovascular (CVD) and respiratory disease (RD) in the elderly (age ⩾65 years), and due to asthma in children (age 5–18 years). We examined these associations in the presence of PM10, PM2.5 (particulate matter <10 and 2.5 µm in diameter, respectively) and ambient gasses. We utilised data on size distribution to calculate NCtot for four modes with median diameters 12, 23, 57 and 212 nm, and NC100 (number concentration of particles <100 nm in diameter) and examined their associations with health outcomes. We used a time series Poisson generalised additive model adjusted for overdispersion, season, day of the week, public holidays, school holidays, influenza, pollen and meteorology, with up to 5 days’ lagged exposure.
Results and conclusions: The adverse health effects of particulate matter on CVD and RD hospital admissions in the elderly were mainly mediated by PM10 and accumulation mode particles with lack of effects for NC100. For paediatric asthma, accumulation mode particles, NC100 and nitrogen oxides (mainly from traffic related sources) were relevant, whereas PM10 appeared to have little effect. Our results suggest that particle volume/mass from long-range transported air pollution is relevant for CVD and RD admissions in the elderly, and possibly particle numbers from traffic sources for paediatric asthma.
Statistics from Altmetric.com
Numerous studies have established evidence of associations between particulate matter (PM) and mortality and morbidity in adults and morbidity in children.1 2 However, which properties of ambient aerosols are responsible for health effects remains unclear. Much of the current discussion concerns particle size, an important determinant of the site and efficiency of pulmonary deposition, and a surrogate for particle source and composition. In the last few decades, airborne particles have mainly been characterised by measurements of mass of two size cuts, mostly PM10 (particulate matter <10 µm in diameter) and more recently PM2.5 (particulate matter <2.5 µm in diameter; fine particles, FPs). The particle size range less than 0.1 µm in diameter, known as ultrafine particles (UFPs), is a unique fraction which, compared to larger PM fractions, contributes to magnitudes higher particle numbers and very little to mass.3 4 The role of UFPs has mostly been addressed in toxicological studies, which showed a number of characteristics and patterns of reactivity specific to UFPs and different from larger particles, including inducing the greatest amount of inflammation per unit PM mass, greater internal doses due to high lung deposition efficiency, enhanced oxidant capacity, and the ability to induce oxidative DNA damage and possibly to enter the systemic circulation in humans.3 5–12 This toxicological evidence indicates that some of the adverse PM health effects reported in epidemiological studies may be mediated by UFPs.13 Only recently, following advances in measuring techniques, could epidemiological designs focus on UFPs, giving modest and mixed evidence and suggesting effects independent of those of FPs.3 Substantial evidence on UFP health effects comes from studies on multi- and single-site panels of patients with asthma and heart disease with short (months) urban background measurement campaigns.14–22 Two mortality time series studies with 3 and 6 years’ urban background measurements of UFPs from Erfurt,23 24 two multi-city time series studies on myocardial infarction,25 26 and a case-crossover study of coronary out-of-hospital deaths in Rome,27 with partly modelled exposure assessment, complete the epidemiological evidence of the health effects of UFPs. These studies vary in design, health outcomes and exposure assessment, address size distribution only to a limited extent, and offer conflicting evidence of the importance of UFPs. Hospital admissions for respiratory diseases are yet to be studied as a health outcome. As the identification of PM size fraction and properties most relevant to health can lead to important clues to biological mechanisms and more efficient control, more studies on the health effects of the smallest and least understood PM fraction, UFPs, are urgently needed.
In this paper we studied the effect of the total number concentration of ultrafine and accumulation mode particles (NCtot) on hospital admissions in the presence of PM10, PM2.5 and gaseous pollutants (carbon monoxide (CO), nitrogen dioxide (NO2), ozone (O3)). We furthermore assigned NCtot to four size modes with presumed different sources and properties to evaluate which are most relevant to health, and examined the role of NC100 (number concentration of particles <100 nm in diameter) which was derived from the four size modes. We studied three health outcomes, hospital admissions due to cardiovascular disease (CVD) in the elderly (age ⩾65), respiratory disease (RD) in the elderly (age ⩾65) and asthma in school-aged children (5–18 years), covering the array of diseases and susceptible populations and allowing for direct comparison across diseases and pollutants, with a focus on UFPs and accumulation mode particles.
METHODS
Health outcomes
We defined three health outcomes based on the International Classification of Diseases, Tenth Revision (ICD-10),28 so that CVD hospital admissions in the elderly (age ⩾65 years) include angina pectoris (I20), myocardial infarction (I21–22), other acute ischaemic heart diseases (I24), chronic ischaemic heart disease (I25), pulmonary embolism (I26), cardiac arrest (I46), cardiac arrhythmias (I48–49) and heart failure (I50); RD hospital admissions in the elderly (age ⩾65 years) include chronic bronchitis (J41–42), emphysema (J43), other chronic obstructive pulmonary disease (COPD; J44), asthma (J45) and status asthmaticus (J46); and paediatric asthma admissions (5–18 years) include asthma (J45) and status asthmaticus (J46). All hospital admissions with these ICD codes as admission diagnoses were included, which implies that up to 2% and 20% of planned admissions were for respiratory and cardiovascular diagnoses, respectively. We extracted daily counts of hospital admissions from the Danish Hospital Register for the 3.5-year (1327 days) period (15 May 2001 to 31 December 2004) in nine hospitals within a 15 km (average of 6 km) radius of the background monitoring station, which service a population of approximately 1.5 million people.
Exposure monitoring and meteorology
The pollutant and meteorological data for the main analyses were measured using a fixed urban background monitor (15 May 2001 to 31 December 2004) located on the roof of a 20 m high building in a park in the centre of Copenhagen, about 300 m east and 50 m west of two streets with typical weekday traffic flows of 26 000 and 56 000 vehicles, respectively. The monitor was placed at a location with minimal contribution from local pollution sources in accordance with WHO guidelines.29 Daily (24 h, midnight-to-midnight) NCtot and mean size distributions (6–700 nm in diameter) were measured by a DMPS (differential mobility particle sizer) as described elsewhere.30 Additionally, daily mean concentrations were available for PM10 (beta attenuation by an SM 200 monitor; Opsis, Furulund, Sweden), CO (M 300 monitor; API, San Diego, USA), NO2 and NOx (M 200A; API), O3 (M400; API), temperature and relative humidity. Measurements of PM2.5 (TEOM Ambient Particulate Monitor; Rupprecht & Patashnick, Albany, New York, USA) not corrected for losses of volatile material, were first available from 3 October 2003 when monitoring of background PM2.5 began in Copenhagen.
Measurements at a kerbside monitor located on a busy street (typical weekday traffic flow of 60 000 vehicles) about 3000 m from the background monitor were available for NCtot and size distributions PM10 and PM2.5 for a 105-day period (22 September 2004 to 26 December 2005), and for NOx for the whole study period (15 May 2001 to 31 December 2004). Levels at this monitor were largely independent of wind direction. Similarly, measurements of NCtot and size distribution PM10 were available for a 47-day (22 April 2005 to 11 September 2005) period from a rural monitor located 30 km southwest of the urban background monitor. The kerbside and rural monitor measurements were used for assessing the spatial correlation of pollutants relevant for the discussion of exposure misclassification resulting from using pollutant measurements from the urban background monitor.
Particle size distribution
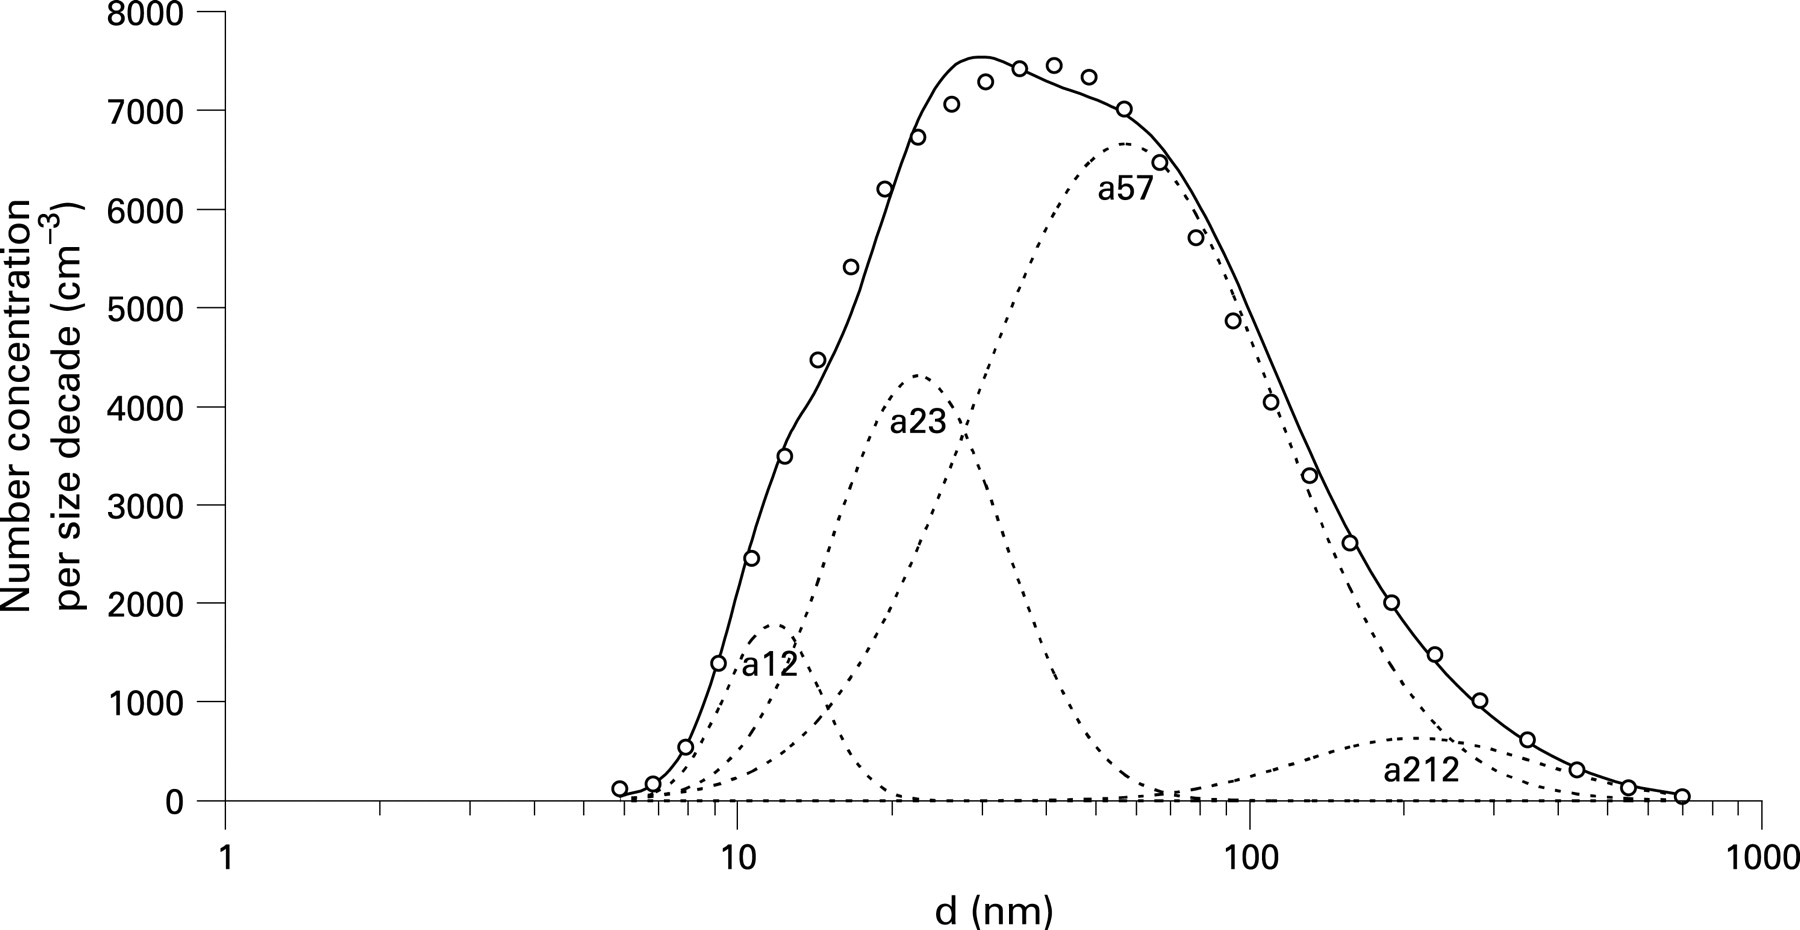
For each day, the average size distribution of particle number concentrations was fitted to a sum of four log-normal modes, a12 (median diameter dm 11.7 nm, geometric standard deviation σ 1.24), a23 (22.6 nm, 1.48), a57 (57.1 nm, 1.96) and a212 (211.7 nm, 1.72). The functional dependence of a single mode on diameter d was defined by the formula,

depicted in fig 1 and explained elsewhere.31 The three smallest modes observed in the busy streets of Copenhagen30 31 were the a12, the a23 and the a57. The a12 mode originates from the nucleation of sulphur compounds with low vapour pressure in exhaust systems. After exiting the exhaust pipe, these particles grow by condensation of volatile organic compounds, especially under cold ambient conditions. An important source of these particles is new diesel cars with oxidising converters, such as taxis. The a23 mode consists of volatile organic compounds attributed to ordinary diesel vehicles. The a57 mode represents soot and accumulation mode particles.

In the urban background in Copenhagen, approximately half of the particle numbers are due to traffic,30 while most of the rest originate from secondary long-range transported particles. These particles, especially in their younger stages, can also be categorised into the three modes discussed above. In order to also achieve acceptable fits for the particle volume distribution, it was necessary to include an additional mode at 212 nm. The a212 mode represents aged secondary long-range transported particles and a large fraction of the particle volume (mass).
The number concentration of urban background particles <100 nm in diameter (NC100) was derived as a12+a23+0.797*a57+0.084*a212. The surface area and volume concentration of each mode were estimated from number concentration assuming uniform spherical shapes with the relevant diameters, resulting in number concentration, surface area and volume concentration being directly proportional.
Influenza and pollen
Influenza epidemics data provided by Statens Serum Institute were available as a weekly percentage of total general physician consultations due to influenza in Copenhagen. Pollen data for mugwort, birch, alder, elm, grass and hazel, as mean counts per m3 of air, were obtained from the Danish Meteorological Institute.
Statistical methods
We applied a generalised additive Poisson time series regression model adjusted for overdispersion, to estimate associations between day-to-day variations in pollutant concentrations (lag 0–5) and day-to-day variations in hospital admission counts for three health outcomes separately.32 A basic model without pollutants was built first, using Akaike’s information criterion, covariate response plots, partial autocorrelation in residual plots and residual plots. We controlled for weather by modelling temperature and dew-point temperature with smoothing spline functions with 4 or 5 degrees of freedom (df), while a smoothing spline of calendar time with 3, 4 or 5 df/year was used to control for long-term trend and seasonality. Influenza (dummy for days above the 95th percentile of the percentage of weekly physician influenza consultations), day of the week, public and school holidays were included in the model via dummy variables. Only grass pollen was associated with the asthma admissions and was included in the paediatric asthma model as a continuous variable, while no pollen type was associated with CVD or RD admissions. A priori it was decided to adjust for school holidays only in the children model, assuming that school holidays would affect the admission rates for children but not for the elderly. Pollutants were introduced into the model as linear terms.
After assessing the effects of single day concentrations (lags 0–5), several day averages were created to include days with the strongest lag effects for NCtot, resulting in a 4-day pollutant average (lag 0–3) for CVD, a 5-day average (lag 0–4) for RD, and a 6-day average (lag 0–5) for asthma. In the case of missing a single day’s exposure, a 4-, 5- or 6-day mean of available measurements was taken. The same averages were applied to other pollutants and meteorological variables to provide for consistent comparison across the health outcome. We estimated all relative risks (RR) per interquartile range (IQR) increment in pollutants. First, we fitted one-pollutant models to examine the independent effects of each pollutant on health, and then multi-pollutant models, with the criterion that the highest allowed correlation coefficient between pollutants in the models was <0.70.
In addition, we performed analyses with hospital admissions in four Copenhagen hospitals within a 5 km radius of the background monitor. Finally, we performed analyses with kerbside NOx measurements as an alternative proxy of fresh traffic exhaust.
We performed analyses in the gam procedure, mgcv package in R statistical software.33
RESULTS
The summary statistics are presented in table 1. The relatively short and incomplete time series of NCtot measurements (578 days) was the result of difficulties encountered in keeping the equipment operating normally for extended periods due to water accumulation in the condensation particle counter.
The daily 24 h average of NCtot was resolved in four size modes (fig 1). NCa57 (number concentration of size mode a57) was the highest of the four modes, accounting for about 63% of NCtot, followed by NCa23, NCa12 and NCa212 (number concentration of size modes a23, a12 and a212) accounting for 28%, 6% and 5% of NCtot, respectively. Modes a57 and a212 accounted for 61% and 46% of the surface area, and 45% and 86% of the volume of NCtot, respectively, whereas a23 and a12 contributed minimally (see table A1 in appendix A). Assuming a PM density of 1.5 g/cm3, the volume concentration given in µm3/cm3 corresponds to µg/m3, and the combined mass concentration of the a57 and a212 modes would be approximately 17 µg/m3 or about 70% of the PM10 mass concentration of 24 µg/m3.30
Urban background NCtot was poorly correlated with PM10 (r (Spearman correlation coefficient) = 0.39) and PM2.5 (r = 0.40) and best correlated with NO2/NOx (r = 0.68/0.66). PM10 and PM2.5 were strongly correlated (r = 0.80). Low or no correlation was found between the four NCtot size modes. NCa212 was most strongly correlated with PM2.5 (r = 0.80) and PM10 (r = 0.63), while NCa57 correlated well with NO2 (r = 0.57). A full table of correlations is provided in table A2 in appendix A.
Urban background NCtot measurements were well correlated with measurements both at the kerbside and at rural stations, with kerbside levels being almost five times higher and rural levels 30% lower than urban background levels (table 2). However, urban background NCa12 was poorly correlated with both kerbside and rural levels, with levels at the kerbside 25 times higher than the urban background. For the larger size modes, a57 and a212, the correlation between urban background and both kerbside and rural levels was high and levels were similar, especially for NCa212. PM10 levels were highly correlated and similar between urban background and rural levels. PM2.5 levels were highly correlated with a small ratio between urban background and kerbside levels, whereas PM10 levels showed weaker correlation and a larger ratio, indicating a contribution of coarse particles from traffic.
No effect of NCtot was detected on CVD admissions (table 3). Significant positive associations between PM10 and both CVD and RD admissions in one-pollutant models remained after adjustment for NCtot. Significant effects of NCtot on RD admissions detected in one-pollutant models diminished after adjusting for PM10 or PM2.5. PM2.5 showed significant association with CVD comparable to that with PM10, and no effect on RD. NO2 showed a significant adverse effect on RD admissions in one-pollutant models, which diminished (RR: 1.01, 95% CI: 0.98 to 1.05) after adjusting for PM10 (1.03, 1.01 to 1.06) in two-pollutant models. No significant associations were detected with paediatric asthma, but adverse effects of NCtot were stronger than those of PM10.
A borderline significant adverse effect of PM2.5 on paediatric asthma was robust in the presence of NCtot or PM10.
NCa212 was significantly associated with all three outcomes in one-pollutant models and this was robust in the presence of other size fractions (table 4), whereas NCa57 was associated with RD only. However, the effects of NCa212 on CVD and RD admissions diminished in the presence of PM10 but remained robust in the presence of PM10 for paediatric asthma. Similarly, the effect of NCa57 diminished in the presence of PM10 for RD (NCa57: 1.02, 0.97–1.07; PM10: 1.04, 1.00–1.09). Observed effects of NC100 (table 4) were almost identical to those for NCtot (table 3). The lag patterns for NCa212 and PM10 were similar for all three endpoints (fig 2), while smaller size modes displayed a generally different lag pattern than NCa212 and PM10. All single-day lag associations are shown in fig 2, where generally more immediate effects of air pollution on CVD were observed, with the strongest effect of PM10 at a 2-day lag, while more delayed effects were observed on RD, where the strongest effect of PM10 was seen at a 4-day lag.

A number of sensitivity analyses were performed to explore the robustness of results to alternative population or pollution proxies. Analyses with data limited to the 38% of CVD and 28% of RD admissions (not performed for paediatric asthma due to the low number of admissions) in hospitals within a radius of 5 km of the urban background monitor gave comparable RR values with wider confidence intervals due to the lower number of admissions (data not shown).
Finally, analyses with a complete series (15 May 2001 to 31 December 2004, n = 1286) of kerbside measurements of NOx showed strong positive associations with paediatric asthma admissions (1.22, 1.10 to 1.36) and weak associations with CVD (1.01, 0.99 to 1.03) and RD (0.99, 0.95 to 1.02) admissions. Estimates were reduced but positive for asthma and unchanged for CVD and RD when analyses were limited to days with available NCtot (asthma: 1.08, 0.95 to 1.23, n = 677; CVD: 0.99, 0.96 to 1.02, n = 643; RD: 1.00, 0.94 to 1.05, n = 677).
DISCUSSION
Our results indicated short-term associations between CVD and RD hospital admissions in the elderly and ambient levels of PM10 and accumulation mode particles, which suggests the relevance of volume and mass of PM for these endpoints, whereas particle numbers as measured in the urban background showed no effects. For paediatric asthma, results were less certain but indicated the relevance of accumulation mode and possibly NC100 and nitrogen oxides, suggesting the importance of traffic related sources, whereas PM10 showed little effect.
It was difficult to separate the effects of PM10 and NCa212 in this study since the two were closely correlated (r = 0.63). NCa212 represents the major fraction of PM10 and the two have almost identical lag structures (fig 2). Moreover, NCa212 levels varied very little between three measuring stations (table 2), confirming that this mode represents accumulation mode PM, mainly due to long-range transport in Copenhagen. Accordingly, in the two-pollutant models (table 4) we cannot exclude the possibility of artifactual association due to colinearity between PM10 and NCa212. However, weak correlation between NCtot and both PM10 and PM2.5 indicated a different time course for the number concentration and mass of PM and allowed separation and comparison of their health effects. As we have shown earlier, PM10 and PM2.5 in Copenhagen originate mainly from long-range transported pollution from secondary sources, biomass and oil combustion and very slightly from local traffic,34 whereas NC100 comes primarily from local traffic. Overall, our results thus suggest that the adverse effects of PM on CVD and RD admissions in the elderly were mediated by accumulation mode or coarse (diameter >2.5 nm) PM, whereas no independent effect of number concentration of UFPs could be identified. The importance of the mass of PM is consistent with the numerous time series studies showing health effects associated with PM2.5 or PM10.1 2
Exposure misclassification is an important challenge in epidemiological studies of the health effects of UFPs.35 As all epidemiological studies of UFP health effects to date have used central site UFP levels as exposure proxies,14–27 the extent of bias in risk estimates due to exposure misclassification remains unknown. Due to large spatial and temporal variations in UFPs, central site concentrations were found to be poorer proxies of personal exposure as compared to PM2.5 or PM10 in time series studies.35 In contrast, a study from Helsinki argued against exposure misclassification based on high correlations between UFP levels at four measuring sites.36 In the present study, the strong correlation between NCa212 measured at different stations in Copenhagen (table 2) suggests that population exposure to accumulation mode particles can be assessed reasonably well by one urban background monitoring station. Furthermore, the indoor penetration of this size range is high.37 In contrast, the number concentrations of size ranges in the UFP fraction (a12, a23 and a57) showed large spatial variation evident in poor correlation between the three monitoring stations, especially for the smallest modes (table 2). Moreover, the penetration of UFPs indoors seems to be lower than that for larger fractions, although there are important indoor sources.37–39 As here we used one urban background monitor for an admission radius of up to 15 km, we can not exclude the possibility that the reported lack of effects of UFPs was due to exposure misclassification. However, the analysis with a hospital admission radius of 5 km from an urban background monitor (used in panel studies which reported the effects of UFPs14–20) showed somewhat stronger but comparable effect estimates as our main analyses with a 15 km radius (results not shown). Assuming exposure misclassification in this study to be higher for smaller size modes, and random, it would bias the risk estimates towards zero.
Additional analyses were performed with kerbside measurements of NOx, an alternative proxy of traffic pollution, for which we had a complete measurement series (1286 days). Since NOx and NCtot both originate primarily from traffic and have comparable temporal and spatial variation, similar health effects from the two are expected. Our kerbside levels of NOx, which were independent of wind direction, are not representative (too high) of personal exposures in this population, but are likely to capture the temporal exposure contrasts due to fresh traffic exhaust in the average street better than NCtot measurements at a high background monitor. The kerbside NOx showed significant positive associations with paediatric asthma admissions (estimates reported in Results), and weak associations with CVD and RD admissions. This suggests that the observed lack of effect of NCtot on CVD and RD admissions in our elderly subjects (table 3) is likely to be real and not due to exposure misclassification bias. On the other hand, the strong effect of NOx indicates the importance of traffic for paediatric asthma, as documented earlier,40 41 and furthermore, probable underestimation of relative risks observed for NCtot in this group (table 3) due to exposure misclassification bias.
The urban background particle number concentration levels in Copenhagen were generally smaller than those observed in other cities.42 43 The Copenhagen urban background site at a height of 20 m is generally higher (Erfurt 4 m, Augsburg 2 m, Amsterdam 7.7 m, Helsinki 4.5 m and 13 m, Barcelona 15 m, Rome 3 m) or as high (Stockholm and Barcelona) as in other cities.43 44 Some variation in particle numbers between cities is explained by meteorological and geographical conditions as well as the position of the monitoring site, both with respect to height and in relation to local sources, especially traffic.42 43 Questions about how the position of background monitors affects the relevance of UFP measurements for health effect studies and the extent of exposure misclassification merits more research.
The existing evidence on UFP effects on CVD shows mixed results. Few studies have assessed the effects of individual size modes and the independence of effects in multi-pollutant models. Two papers from the HEAPSS (Health Effects of Particles on Susceptible Populations) multi-centre study reported the effects of UFPs on first myocardial infarction26 and hospital readmission among myocardial infarction survivors.25 A related case-crossover study of out-of-hospital coronary deaths found stronger associations with UFPs than with PM10.27 Two cardiovascular mortality studies offer conflicting results, with the initial report showing similar effects of UFPs and PM2.5,23 and the recent follow-up showing only associations with UFPs and none with PM10 or PM2.5.24 Two multi-city panel studies in elderly subjects with coronary heart disease, based on the European ULTRA (Exposure and Risk Assessment for Fine and Utrafine Particles in Ambient Air) collaboration, showed results consistent with our findings in favour of larger cuts PM. De Hartog et al showed stronger associations of cardiorespiratory symptoms with PM2.5 than with UFPs,18 while Ibald-Mulli et al in the same panel failed to find adverse effects of either UFPs or FPs on blood pressure or heart rate.19 On the other hand, another ULTRA study on the same panel reported strong associations of decreased heart rate variability, a predictor of mortality, with UFPs and weak associations with fine and coarse PM.21 Finally, a fourth ULTRA study, limited to a panel of the elderly in Helsinki, found the strongest associations between exercise induced ST-segment depression (proxy for myocardial ischaemia hospital admissions) and accumulation mode particles and FPs, weaker effects for UFPs, and none for coarse PM.17 These mixed results merit further research and point possibly to the relevance of different PM size cuts for different CVD definitions and outcomes (mortality vs morbidity) and/or different localities.
With respect to RD, the epidemiological literature on UFP effects is sparse. A study from Erfurt showed an association between respiratory mortality and NCtot and most of the size ranges as well as the cumulated volume of number concentration of particles interpreted as PM2.5.24 Three panel studies on adults with asthma point, in contrast to our report, to the relevance of UFPs. Peters et al reported associations between a decrease in peak expiratory flow (PEF) and an increase in self-reported symptoms for both UFPs and PM10 (stronger for UFPs).14 Similarly, Penttinen et al found an association between PEF deviations and UFPs, but none with accumulation mode, FPs or coarse particles, while no effects were detected on asthma symptoms or medication use.15 Von Klot et al reported stronger associations for UFPs and FPs than for coarse particles with both asthma medication use and symptoms.16 Differences in the results of these studies compared with ours may be partially explained by different endpoints, as the three studies14–16 focused on symptoms in adults with asthma, whereas ours considered hospital admissions mainly for RDs other than asthma. On the other hand, two multi-centre ULTRA panel studies on respiratory symptoms in elderly subjects with coronary heart disease showed results similar to ours. De Hartog et al found stronger associations between cardiorespiratory symptoms and PM2.5 than with UFPs,18 while Timonen et al reported associations between urinary concentrations of lung Clara cell protein CC16, a marker of lung damage, and PM2.5 but none with UFPs.20 This set of results is too varied to provide conclusions but may indicate the relevance of particle numbers for asthma and mass for other RDs.
Our results for paediatric asthma showed higher effect estimates for PM2.5, NCa212, NCtot and NC100 than for PM10, with accumulation mode PM in terms of NCa212 indicating the strongest effects. A single study to date assessing UFP effects in children, in contrast to ours, reported weak associations of FPs and UFPs with deficits in peak expiratory flow, and strong associations with PM10.22 However, in a study of source apportionment of PM10 we have previously found the strongest associations to be between vehicle sources (traffic exhaust) and paediatric asthma admissions.34 This is in keeping with the strong association with kerbside NOx in the present study and with current evidence on the importance of traffic related pollution and childhood asthma.40 41
The limitations of the present study include limited statistical power due to a relatively short and incomplete NCtot time series caused by difficulties in long-term particle counting, as experienced elsewhere.43 Further lack of power in estimating effects for paediatric asthma is the result of a low number of admissions. However, a strength of the present study is that it is unique in linking measured number concentration and the mass of different size modes of UFPs and FPs to three morbidity outcomes at a single location, providing the possibility of comprehensive direct comparisons of pollution effects across diseases (CVD and RD in the elderly, and paediatric asthma).
CONCLUSION
In conclusion, we found that the adverse health effects of PM on CVD and RD hospital admissions in the elderly in Copenhagen were mediated mainly by PM10 and/or accumulation mode particles, whereas the number concentration of urban background UFPs seemed less relevant. For paediatric asthma, the results indicated the relevance of accumulation mode and possibly UFPs and nitrogen oxides (relevant for traffic related sources), but results were less certain than for the elderly. Exposure misclassification bias in this study may have caused underestimation of the effects of UFPs in paediatric asthma, whereas the lack of effects of UFPs for CVD and RD admissions is believed to be correct.
Main messages
Particulate matter has been associated with short term morbidity and mortality, but there is limited evidence concerning ultrafine particles.
This study found that particulate matter related cardiovascular and respiratory hospital admissions in the elderly were not mediated by ultrafine particles but rather by the mass of larger fractions.
For paediatric asthma admissions, results indicated the relevance of accumulation mode particles as well as ultrafine particles and nitrogen oxides (relevant for traffic related sources).
Policy implications
Reducing particulate matter levels may contribute to reducing associated morbidity.
Control of particulate matter of all size cuts is necessary as different size cuts seem relevant for different health outcomes.
Appendix A
| n (days) | Mean (25th–75th percentile) | |
| Surface area concentration (µm2/cm3) | ||
| NCtot* | 578 | 213 (117–271) |
| NCa12 | 578 | 0.2 (0.1–0.3 ) |
| NCa23 | 578 | 4.9 (2.8–6.7) |
| NCa57 | 578 | 130 (82–159) |
| NCa212 | 578 | 99 (23–148) |
| Volume concentration (µm3/cm3) | ||
| NCtot | 578 | 8.5 (3.9–11.1) |
| NCa12 | 578 | 0.00 (0.00–0.00) |
| NCa23 | 578 | 0.03 (0.01–0.04) |
| NCa57 | 578 | 3.8 (2.4–4.7) |
| NCa212 | 578 | 7.3 (1.7–10.9) |
*NC, number concentration; tot, total (all particles 6–700 nm in diameter); a12, size mode with mean diameter of 12 nm; a23, size mode with mean diameter of 23 nm; a57, size mode with mean diameter of 57 nm; a212, size mode with mean diameter of 212 nm.
| NCtot* | NC100† | NCa12 | NCa23 | NCa57 | NCa212 | PM10 | PM2.5 | CO | NO2 | NOx | NOxKerbside | O3 | Temperature | |
| NC100 | 0.98 | – | ||||||||||||
| NCa12 | 0.31 | 0.35 | – | |||||||||||
| NCa23 | 0.57 | 0.64 | 0.18 | – | ||||||||||
| NCa57 | 0.87 | 0.84 | 0.20 | 0.19 | – | |||||||||
| NCa212 | 0.29 | 0.16 | 0.07 | −0.16 | 0.32 | – | ||||||||
| PM10 | 0.39 | 0.28 | 0.02 | −0.12 | 0.45 | 0.63 | – | |||||||
| PM2.5 | 0.40 | 0.29 | 0.07 | −0.25 | 0.51 | 0.82 | 0.80 | – | ||||||
| CO | 0.54 | 0.48 | 0.07 | 0.33 | 0.43 | 0.50 | 0.37 | 0.46 | – | |||||
| NO2 | 0.68 | 0.61 | 0.10 | 0.41 | 0.56 | 0.36 | 0.35 | 0.42 | 0.70 | – | ||||
| NOx | 0.66 | 0.60 | 0.09 | 0.42 | 0.54 | 0.35 | 0.32 | 0.40 | 0.72 | 0.99 | – | |||
| NOxKerbside‡ | 0.36 | 0.35 | 0.00 | 0.31 | 0.32 | 0.13 | 0.18 | 0.28 | 0.48 | 0.60 | 0.63 | – | ||
| O3 | −0.12 | −0.06 | 0.16 | −0.20 | −0.02 | −0.24 | −0.21 | −0.20 | −0.57 | −0.55 | −0.58 | −0.33 | – | |
| Temperature | −0.06 | −0.05 | 0.09 | −0.24 | 0.06 | −0.28 | 0.12 | −0.01 | −0.49 | −0.22 | −0.22 | −0.10 | 0.40 | – |
| RelativeHumidity | −0.04 | −0.10 | 0.02 | −0.06 | −0.07 | 0.49 | 0.05 | 0.21 | 0.38 | 0.25 | 0.26 | 0.07 | −0.63 | −0.36 |
*NC, number concentration of particles; tot, total (all particles 6–700 nm in diameter); a12, size mode with mean diameter of 12 nm; a23, size mode with mean diameter of 23 nm; a57, size mode with mean diameter of 57 nm; a212, size mode with mean diameter of 212 nm.
†NC100 = a12+a23+0.797*a57+0.084*a212.
‡NOxKerbside, NOx levels measured at kerbside monitor.
REFERENCES
Footnotes
Funding: This study was supported by the Danish Research Council, grant no. 2052-03-16, AIRPOLIFE (Air Pollution in a Life Time Health Perspective). ZJA and SL are partners of ECNIS (Environmental Cancer Risk, Nutrition and Individual Susceptibility), a network of excellence operating within the European Union 6th Framework Program, Priority 5: “Food Quality and Safety” (contract no. 513943).
Competing interests: None declared.