Article Text

Abstract
Objectives: To determine whether the effect of black smoke on cardiorespiratory mortality is modified by cold temperatures.
Methods: Poisson regression models were used to investigate the relationship between lagged black smoke concentration and daily mortality, and whether the effect of black smoke on mortality was modified by cold temperature for three Scottish cities from January 1981 to December 2001.
Main results: For all-cause respiratory and non-cardiorespiratory mortality, there was a significant association between mortality and lagged black smoke concentration. Generally the maximum black smoke effect occurred at lag 0, although these estimates were not statistically significant. A 10 μgm−3 increase in the daily mean black smoke concentration on any given day was associated with a 1.68% (95% CI 0.72 to 2.65) increase in all-cause mortality and a 0.43% (95% CI −0.97 to 1.86), 5.36% (95% CI 2.93 to 7.84) and 2.13% (95% CI 0.82 to 3.47) increase in cardiovascular, respiratory and non-cardiorespiratory mortality, respectively, over the ensuing 30-day period. The effect of black smoke on mortality did not vary significantly between seasons (cool and warm periods). For all-cause, cardiovascular and non-cardiorespiratory mortality the inclusion of interaction terms did not improve the models, although for all-cause and non-cardiorespiratory mortality there was a suggestion for interaction between temperature and recent black smoke exposure.
Conclusions: The results of this study suggested a greater effect of black smoke on mortality at low temperatures. Since extremes of cold and particulate pollution may coexist, for example during temperature inversion, these results may have important public health implications.
Statistics from Altmetric.com
Low temperature has a strong association with increased cardiorespiratory mortality.1 2 In time series studies looking at the short-term effects of air pollutants on mortality, temperature has usually been considered a confounder in relation to air pollution effects3 and adjusted for by including in the regression models temperature measurements made on the same day as the health outcome and/or temperature measured up to a few days previously. However, the results of recent studies4 5 have suggested that cold temperature effects on mortality persist for considerably longer time periods.
We postulated that there may be an interaction between (cold) temperature and particulate air pollution in their effect on health. This is biologically plausible as, for example, it is known that cold adversely affects respiratory mucociliary function6 and may thus impede the clearance of pollutants. Cold temperature has also been associated with increased circulatory fibrinogen levels7 and might therefore increase thrombotic risks associated with air pollution.
The aims of this study were firstly to determine the lagged effects of black smoke on mortality and secondly to determine whether the effect of black smoke on cardiorespiratory mortality is modified by cold temperatures.
METHODS
Health data
The Information and Statistics Division (ISD) of the Common Services Agency (CSA) of the National Health Service in Scotland supplied mortality data for the period January 1981 to December 2001 for residents of the three largest Scottish cities: the Glasgow conurbation (population approximately 1 million), Edinburgh City (population approximately 400 000) and Aberdeen City (population approximately 200 000). Deaths from all (non-accidental) causes (ICD-9 codes <800), cardiovascular causes (ICD-9 codes 410–414, 426–429, 434–440: cerebral ischaemia), respiratory causes (ICD-9 codes 480–487 and 490–496: chronic obstructive pulmonary disease, asthma and pneumonia) and non-cardiorespiratory causes (all non-accidental causes minus the cardiorespiratory codes specified above) were considered.8
Meteorological and air pollutant data
Hourly temperature data for each of the three cities were obtained from the British Atmospheric Data Centre (BADC) website.9 Data were obtained from one meteorological station within each city. These were used to calculate the mean daily temperature for each day, taken as the average of the 7 am to 11 pm hourly values. Our previous work4 had observed a non-linear relationship between temperature and mortality: mortality increased as temperature decreased but with a steeper increase at lower temperatures. For simplicity, this was modelled as a double linear relationship by creating temperature variables representing mean daily temperature above and below 11°C. These variables (referred to here as “high” and “low”, respectively) were defined in terms of usual mean daily temperature, t, as follows:
if t<11°C: Thigh = 0 and Tlow = 11−t
if t>11°C: Thigh = 11−t and Tlow = 0
if t = 11°C: Thigh = 0 and Tlow = 0.
We had also observed the effect of temperature on mortality to persist for periods beyond 2 weeks.4 Therefore, these variables were lagged by 0 (same day), 1–6 days (ie, average of temperatures on the previous 1–6 days), 7–12 days, 13–18 days, 19–24 days and 25–30 days. Days were grouped in this way to minimise the number of variables in the regression models and thus reduce the problem of multicollinearity.
For Aberdeen and Edinburgh, daily mean black smoke measurements were obtained from a centrally located site within each of the cities. For the Glasgow conurbation, black smoke measurements from seven separate sites were available and the population of the area was split into seven separate sub-populations based on postcode sector, with each sub-population ascribed the black smoke exposure of the nearest black smoke site. Multiple imputation methods, available within the software package Solas v2.0,10 were used to replace missing black smoke data at the Edinburgh site (data from two additional sites that were operational for part of the study period were used as predictors) and for each of the seven Glasgow sites (all seven sites were used as predictors for each site). Multiple imputation methods were preferred to complete case analysis as the latter may lead to overfitted models and biased estimates if the data are not missing at random.11 No imputation for missing black smoke data was possible for Aberdeen because of the absence of concurrent monitoring sites. Approximately 15% of the total black smoke data was missing. After imputation, this was reduced to 5% (and was largely confined to the Aberdeen dataset).
Statistical analysis
All analyses were carried out in Splus (v 2000) using Poisson models (generalised linear models, GLMs) with natural cubic splines to capture seasonal and other long-term effects. The convergence tolerances of the GLM function were set to 10−9 with a limit of 1000 iterations.2 Data for the nine areas were analysed separately and the resulting estimates combined using inverse variance weighting.12 The regression models for each area included terms for day of week (indicator variables) and “season” (a smoothed function of date with 7 degrees of freedom (df) per year) as well as the 12 temperature variables described above. The decision to use 7 df per year to capture season and other long-term trends was based on the findings of the NMMAPS mortality re-analysis study.13 Models also included terms representing lagged black smoke and interactions between black smoke and temperature as described in detail below. The overdispersion parameter (estimated from the GLM models) was close to 1, suggesting little additional variation beyond Poisson variation, so a simple Poisson model was assumed to be appropriate.
Black smoke and mortality
To determine the most suitable exposure measurement for black smoke, lagged effects of black smoke on mortality (up to 1 month) were investigated. The lag periods investigated were identical to the temperature lag periods (ie, 0, 1–6, 7–12, 13–18, 19–24 and 25–30 days). Mean black smoke levels in each period were calculated and the resulting variables included in the model simultaneously. Since the coefficient for each 6-day period estimates the effect of an increase in black smoke over 6 days, these coefficients were divided by six for comparability with the lag 0 coefficient.4 Results are presented as the percentage increase in mortality on a given day associated with a 10 μgm−3 increase in black smoke on 1 day within each lag period. Black smoke effects by “season”, where season was represented by a binary variable representing either the cool period (October to March) or the warm period (April to September) were also investigated.
Black smoke and temperature interactions
Initial results suggested that black smoke effects might exist at lag periods of a few weeks or more. Therefore, initially, interactions between temperature and all six black smoke variables were considered. Twelve temperature variables and six black smoke variables in the models would have given rise to a potential 72 interaction terms. To reduce the possibility of false positive results due to multiple testing, it was decided to focus on interactions between black smoke and the recent (lag 1–6 days) temperature variable only; this temperature lag showed the greatest effect on mortality in our previous study.4 Interactions with same day (lag 0) cold temperature were not examined as the previous study4 had shown an almost negligible effect of this temperature variable. Thus, regression models were constructed that included the complete set of six black smoke and 12 temperature variables, but with only six interaction terms defined as the products of recent temperature and each of the black smoke variables (model 1).
Model 1
Model 1 is a two-range temperature model (Tlow: T⩽11°C, Thigh: T⩾11°C) with temperature/black smoke interaction:

where each summation refers to a set of six terms (i = 1,…6) corresponding to lags 0, 1–6, 7–12, 13–18,19–24 and 25–30 days. In particular, Tlow2 refers to low temperature (⩽11°C) lagged 1–6 days.
Tests for a trend of increasing black smoke effects as temperature decreased were based on the sign and statistical significance of these terms. Likelihood ratio tests were used to assess the overall statistical significance of the six interaction terms in each outcome model.
Where a statistically significant interaction was found, a second method was used to explore the shape of the trend in black smoke effect at different temperatures without assuming, as in the first method, that there was a linear increase in the size of the black smoke effect as temperature decreased (model 2).
Model 2
Model 2 is a five-range temperature model (⩽1°C, 1–6°C, 6–11°C, 11–16°C, ⩾16°C) with temperature/black smoke interaction:

where T21, T22, T23,T24 are indicator variables, that is, taking values 1 or 0, corresponding to the four lowest temperature ranges for temperature lagged 1–6 days.
In this approach, models were constructed that contained the complete set of six black smoke and 12 temperature variables plus terms representing the product of black smoke and each of four indicator variables corresponding to temperature ranges <1°C, 1–6°C, 6–11°C and 11–16°C (reference category >16°C). Initial investigations of the temperature data revealed that 90% of the days fell within the temperature range 1–16°C and it seemed logical to divide these data into categories of 5°C (1–6°C: 20% of data, 6–11°C: 32% of data and 11–16°C: 30% of data). Only 4% of the days had a daytime mean temperature of <1°C and as we are specifically interested in interactions with cold temperature we decided not to reduce power by dividing this category further. From the results, estimates of the effects of black smoke within each temperature range were found.
Sensitivity analyses
The sensitivity of the interaction results to whether we imputed for missing black smoke data or not was investigated.
RESULTS
Table 1 shows mean daily deaths, temperature and black smoke, both for the whole year and for the cool (October to March) and warm (April to September) periods separately. For all outcome groups, mean daily deaths were higher in the cool period than in the warm period. The mean daily temperature was similar between the three main areas; 8.8°C in Aberdeen, 9.5°C in Edinburgh and 9.6°C in Glasgow. Daily mean black smoke concentrations ranged from a low of 8.3 μgm−3 in Aberdeen to 18.8 μgm−3 in the most centrally located Glasgow black smoke site. Black smoke concentrations were typically higher in the cool season. The Pearson product moment correlation coefficient between the Glasgow black smoke sites was between 0.49 and 0.86, while the correlation between the Aberdeen and Edinburgh black smoke sites, both with each other and with the Glasgow sites, was slightly lower (0.31–0.56).
Figure 1 shows the annual distribution of mortality, black smoke and temperature for Edinburgh. Data over the entire study period (1981–1998 for Edinburgh) were averaged to produce black smoke, mortality and temperature values for an “average year”. Both all-cause mortality and black smoke concentrations show a similar distribution over the year, with higher levels in the winter.

Black smoke and mortality
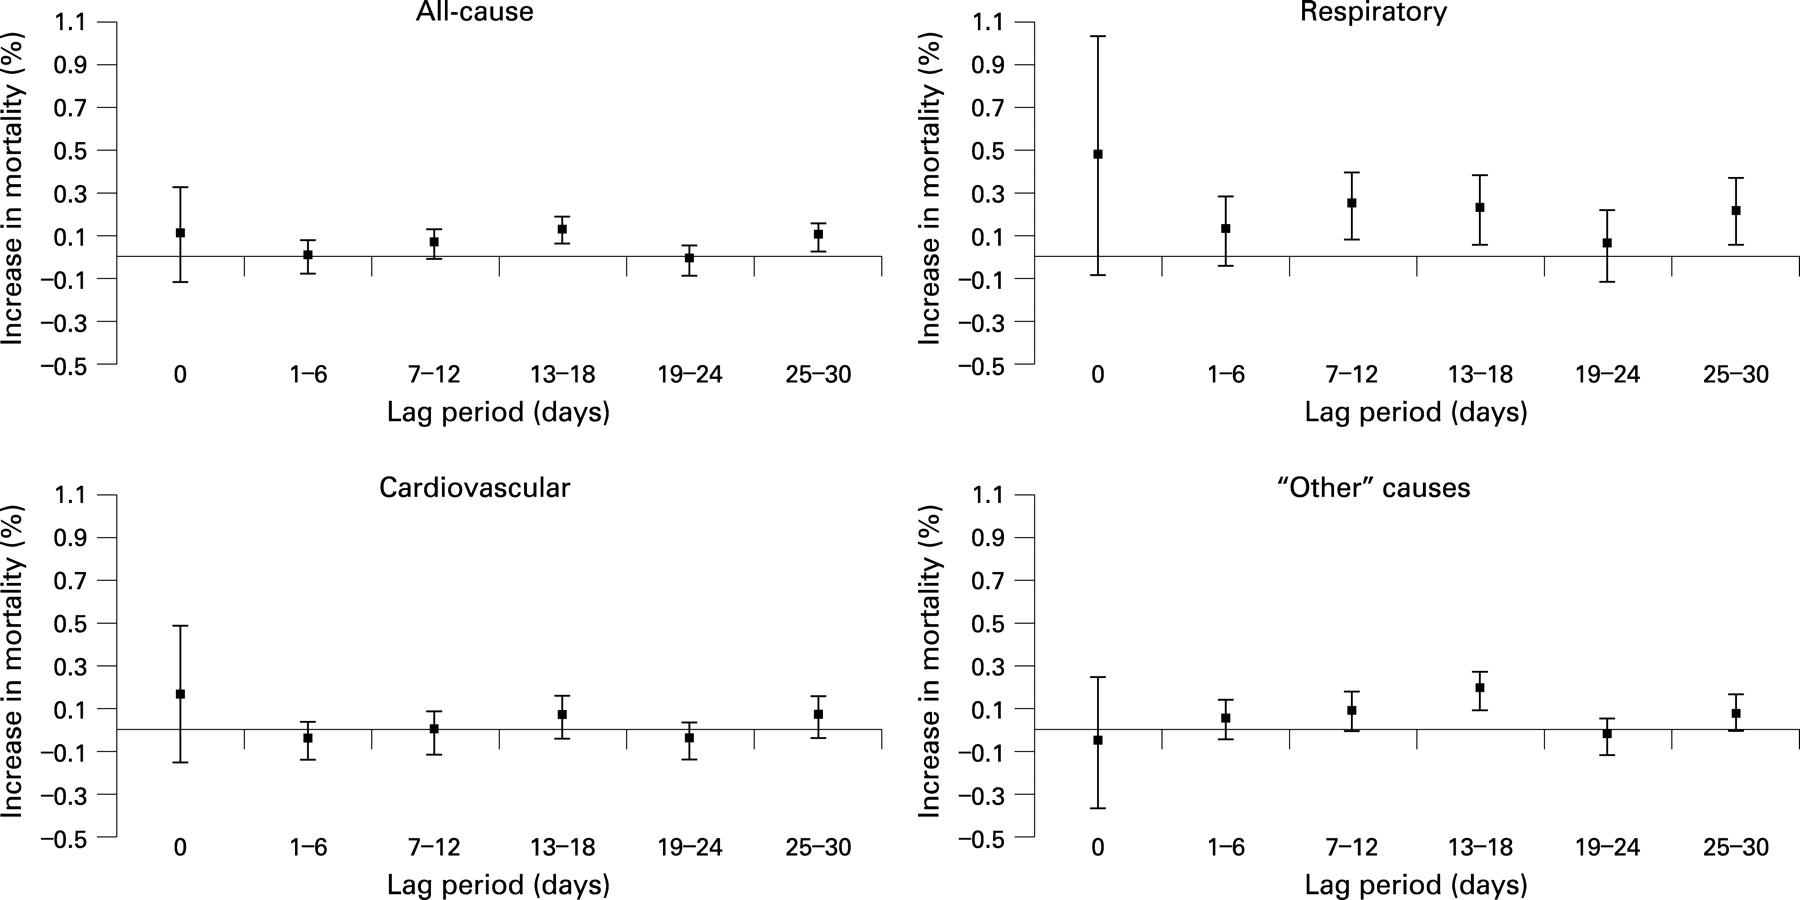
Figure 2 shows the combined results from all three cities for the percentage increase in mortality associated with a 10 μgm−3 increase in black smoke at increasing lag. All coefficients refer to the effect of a 1 day increase in black smoke concentration within each lag period (see Methods). For all-cause, respiratory and cardiovascular mortality, the maximum black smoke effect appeared to be at lag 0, although these estimates were not statistically significant (the standard errors for lag 0 coefficients were always much greater than those based on longer averaging periods). For three of the health outcomes (all-cause, respiratory and non-cardiorespiratory) a significant association was observed between mortality and black smoke lagged by 13–18 days, followed by a non-significant effect of black smoke at lag 19–24 days and an apparent increase in effect at lag 25–30 days. No significant associations between cardiovascular mortality and any of the black smoke lag periods were observed. The estimated percentage increases in mortality on any given day associated with a 10 μgm−3 increase in black smoke on any one day during the period 13–18 days earlier were 0.13 (95% CI 0.06 to 0.19) for all causes, 0.06 (95% CI −0.03 to 0.16) for cardiovascular, 0.22 (95% CI 0.06 to 0.38) for respiratory and 0.19 (95% CI 0.10 to 0.28) for non-cardiorespiratory mortality. Results for the individual areas (see supplementary data) were fairly consistent across the nine areas, with the maximum black smoke effects tending to occur at lags 0 and 2–3 weeks.
The relationship between cold temperature and mortality has been described in full previously.4
Table 2 shows the estimated percentage increase in mortality over a 30-day period associated with a 10 μgm−3 increase in the black smoke concentration on a given day (these were found by summing the black smoke coefficients for individual days). A 10 μgm−3 increase in the black smoke concentration on a given day was associated with a 1.68% (95% CI 0.72 to 2.65) increase in all-cause mortality and a 0.43% (95% CI −0.97 to 1.86), 5.36% (95% CI 2.93 to 7.84) and 2.13% (95% CI 0.82 to 3.47) increase in cardiovascular, respiratory and non-cardiorespiratory mortality, respectively, over the ensuing 30-day period.
Table 3 shows the results from the regression models investigating the interaction between black smoke and season on all-cause mortality. An overall (likelihood ratio) test of the difference between the coefficients for cool and warm seasons gave p = 0.26 and none of the individual terms were statistically significant. Thus, these results did not suggest that the effect of black smoke on all-cause mortality is modified by season. None of the interactions between the effect of black smoke and season on other mortality outcomes were significant.
Black smoke and temperature interactions
Table 4 shows the coefficients from the Poisson model, and associated 95% confidence intervals, for the interactions between the six black smoke lag periods and recent (lag 1–6) temperature. A zero value indicates no interaction and positive values indicate that black smoke effects increase as temperature decreases.
The confidence intervals for the individual interaction terms suggest some evidence of a significant interaction between recent (lag 1–6) black smoke and recent (lag 1–6) temperature on all-cause, respiratory and non-cardiorespiratory, but not cardiovascular, mortality. For respiratory mortality, there is also a significant interaction between black smoke lagged by 13–18 days and cold temperature. Overall (likelihood ratio) tests of whether the set of six interaction terms differed significantly from zero gave p = 0.28 for all-cause mortality, p = 0.37 for cardiovascular mortality, p = 0.02 for respiratory mortality and p = 0.24 for non-cardiorespiratory mortality. The results of these overall tests suggest that the effect of black smoke on respiratory mortality (but not all-cause, cardiovascular or non-cardiorespiratory mortality) is significantly modified by temperature.
Figure 3 shows the percentage change in mortality associated with an increase in previous week black smoke of 10 μgm−3 at selected (previous week) temperature ranges (>1°C, 1–6°C, 6–11°C, 11–16°C and >16°C), derived from the models investigating the interaction between black smoke and the four indicator variables representing different temperature ranges. The results suggest that the interaction may only be important at the extreme ends of the temperature range, but it is difficult to draw any firm conclusions.

Sensitivity analysis
The sensitivity of the coefficients described in table 4 to the imputation (or not) of missing black smoke data was investigated (see supplementary data). Generally, the interaction coefficients obtained from models without imputation for missing data are slightly smaller than those obtained from models with imputation for missing data (but confidence intervals for the two sets overlap).
DISCUSSION
Our study, conducted across the three largest Scottish cities, aimed to investigate the lagged effects of black smoke on mortality and to determine whether there was any interaction between cold temperature and black smoke on cardiorespiratory mortality.
The strongest association was observed between black smoke and respiratory mortality with little suggestion of a significant association between black smoke and cardiovascular mortality. The absence of an association between black smoke exposure and cardiovascular mortality was unexpected as other studies have consistently shown an association between this outcome and particulate pollution. The main difference between the present study and most of the earlier studies is that the earlier studies tended not to investigate longer lag periods for temperature, and therefore it is possible that some of the effects previously attributed to pollutants were due to residual confounding by temperature.
The observed lag structure between black smoke and mortality is of particular interest. Overall, the biggest association (although not significant) tended to be between same day black smoke and mortality. However, significant associations were also observed between mortality and black smoke lagged by approximately 2 and 4 weeks. This observed lag structure suggests that, in this population, consideration of pollutant measurements of only a few days prior to the health outcome, as has been the norm in the majority of time series studies, could lead to an underestimation of the full extent of the pollutant effect. The regression models also included lagged temperature measurements (1 month) and therefore it is unlikely that the observed black smoke effects were due to residual confounding from temperature.
A number of studies have also investigated the lag structure between pollutant exposure and mortality. A Dublin based study by Goodman et al14 observed an association between mortality and lagged black smoke exposure. Again the strongest associations were typically observed between mortality and immediate (same day) particle exposure. For cardiovascular mortality this effect declined to zero within 3 days. For respiratory mortality, however, a similar pattern to that observed in our own study was apparent, with black smoke exposure associated with a significantly increased risk over the first week, followed by a negative association in week 2, before the risk became positive and significant again in weeks 3 and 4. Zanobetti et al,15 who used distributed lag models to investigate the association between mortality and PM10 (lagged up to 40 days) across 10 European cities, also observed the biggest association to be between same day PM10 and mortality, with effects generally decreasing and then rising to another peak at approximately 4 weeks’ lag. One could speculate whether the delayed effects are the consequence of infections or other inflammatory processes progressively developing after the initial acute exposure.
The pattern in fig 2 is of relative “peaks” in pollution effects at lags of 0 (except for “other” causes), 13–18 and 25–30 days, with intervening “dips” at lags of 1–6 and 19–24 days. This is slightly suggestive of mortality displacement effects, whereby a rise in air pollution brings forward the deaths of frail individuals by a short period of days, resulting in a drop in the number of daily deaths a little time after a peak in air pollution. Previous analysis of such effects in the Glasgow population16 suggested short-term air pollution effects on mortality up to at least 1 month. Dominici et al17 applied Fourier analysis to distinguish dominant frequencies in the variation of short-term pollution effects on mortality and found evidence of effects on time scales of up to 60 days.
The results of our study did not suggest that the effect of black smoke on any of the mortality outcomes studied is modified by season (cool and warm periods). One possible explanation for this finding could be that there is only a small difference in the mean temperature between the two seasons. A number of studies have investigated the interaction between particulate air pollution and season, with somewhat inconclusive results. Two studies in the USA18 19 did not observe any effect modification of particulate pollution on mortality by season, whereas studies in Europe20 21 and the UK22 have observed the effect of particulate matter on mortality to be greater in the warm season than in the cold season. However, it is possible that at least some of the apparent seasonal effects in previous studies may have been due to inadequate adjustment for temperature.
There are plausible explanations for the finding of a significant association between black smoke and mortality from non-cardiorespiratory causes in a study based on routinely collected mortality data. This group contained all subjects who did not have a specified cardiac or respiratory code recorded as the primary (underlying) cause of death. However, the “mode” or secondary cause of death in many diseases, regardless of the primary underlying pathology, is often respiratory and it is possible that air pollution contributes to this final “mode” of death. A further explanation might be that a true association exists between air pollution and some causes of death other than cardiorespiratory reasons. Moreover, the actual mode of death or the terminal event might be related to acute effects of pollution, even though the underlying certified primary cause might not be the result of day to day changes in pollution concentrations. For example, while long-term exposure to air pollution might be causally linked to lung cancer after several years’ exposure,23 one would not expect deaths from lung cancer per se to be related to short-term changes in pollution on a scale of days or even months. However, lung cancer, and other conditions such as bladder cancer, in view of the strong causal association with tobacco smoking, would be very likely to co-exist with other lung pathology, notably chronic obstructive pulmonary disease (COPD). Thus subjects with this co-morbidity might thus show an association between day of death and air pollution, in the same way as subjects with COPD alone.
Goodman et al14 also observed an association between black smoke and non-cardiorespiratory causes of death (defined as all-cause deaths minus cardiorespiratory deaths). It is also possible that the observed results are an artefact of the methodology. The association between air pollution and mortality has been consistently demonstrated in a wide range of studies. A common artefact across the different methodologies employed seems unlikely.
The results of our study provide some evidence of an interaction between cold temperature and black smoke in their effect on respiratory mortality. There was also modest evidence for interaction in the case of all-cause and non-cardiorespiratory mortality but none for cardiovascular mortality. For all-cause mortality and non-cardiorespiratory mortality there was a significant interaction between the previous week’s black smoke and the previous week’s temperature. The biggest interaction was observed for respiratory mortality between black smoke (lagged by approximately 2 weeks) and cold temperature (averaged over the previous 6 days). The results lend support to our hypothesis that cold increases the susceptibility of the respiratory tract to particulate air pollution in a way which has analogies to the susceptibility to infection that may result in part from reduced mucociliary clearance.24 Experimental adaptation in animals shows that cold exposure reduces mucociliary clearance,25 while an extensive systematic review in humans has mustered physiological evidence for the adverse consequences of cold on elements of the mucociliary pathway (ciliary function, periciliary aqueous layer and mucus gel layer).6 Further epidemiological work is needed to corroborate this hypothesis, especially in subjects with COPD.
Only a few studies have previously studied the interaction between particulate air pollution and temperature, and these studies have tended to focus on the interaction between pollution and high temperature rather than low temperature. Katsouyanni et al26 found some evidence that the effect of smoke on mortality was greater at higher temperatures. A study by Rainham et al27 investigated the relationship between air pollutants (O3, SO2, NO2 and CO but not particulates), humidex (a summer temperature and humidity index) and mortality, and observed air pollution to have a small confounding effect on the humidex effect estimates. A further study28 examined whether the effect of particulate air pollution on mortality was modified by weather conditions (but not specifically temperature) and found little evidence that this was the case. A recent study29 did investigate the interaction between particulate air pollution (PM) and both (extreme) hot and cold temperatures. The study observed that PM increased mortality only on days when the 24 h mean temperature was above its 10th percentile, but there was no evidence that PM increases mortality when the 24 h mean temperature was below its 10th percentile.
The first approach taken in this study to investigate the interaction between black smoke and temperature assumed that the relationship between mortality and the interaction between black smoke and temperature is linear in nature. It is accepted that in a biological system such a “linear” relationship is unlikely to be the case and that it may only be at temperature extremes that the black smoke effect is significantly increased. In view of this, for those outcomes where a statistically significant interaction was observed (using a linear model) further investigations were carried out (using indicator variables to represent different temperature ranges) to assess the shape of this interaction, the results of which did seem to suggest it was only at extremely cold temperatures that the interaction was important. To keep the number of interaction terms to a minimum and to reduce multiple testing, this study only investigated interactions between black smoke and recent exposure to cold temperature (lag 1–6) and it is plausible that interactions between black smoke and other temperature lags may exist. However, we still investigated 35 interaction terms and therefore significant results should be interpreted with caution.
In addition to the shape of the interaction between black smoke and temperature in their effect on mortality, some discussion is required regarding the shape of the relationship between temperature and mortality which has been shown to exhibit significant variation from region to region.30 31 For example, some studies have reported a linear or reverse J-shaped relationship, with mortality typically increasing as temperature drops,30 while others have reported a more U- or V-shaped relationship between temperature and mortality, with the maximum number of deaths occurring at each end of the temperature scale.2 32 To reflect this varying relationship, a number of methods have been used to model the relationship between temperature and mortality from “simple” linear approaches to more sophisticated methods such as natural cubic splines and other functions.33
In this study, temperature was modelled as two separate linear relationships over different parts of the temperature range constrained to join at a “knot”. While accepting that the true relationship between mortality and temperature is probably smooth and non-linear, this double linear approach was considered an adequate and easily interpretable representation for most analyses. For convenience, our models allowed a change in gradient at approximately 11°C, but in reality the change is probably gradual.
The only pollutant considered in this study was black smoke (data on black smoke concentrations for our study area were extensive in both spatial and temporal terms, whereas data on other pollutants were much more limited) and it is possible that some of the observed effects could be due to confounding by other, unmeasured pollutants. Other pollutants (PM10, O3, CO, SO2, NO2) have been studied previously for (part of) this population and a consistent association with mortality was only shown for black smoke.8 However, additional work investigating the effect of other pollutants on mortality has been carried out for the population described here and will be reported on in a subsequent paper.34
In conclusion, we have observed a delayed effect of black smoke on mortality in this Scottish population. This may have implications for future recommendations of the Air Quality Standards of the UK Air Quality Archive. We have also found some evidence that the effect of black smoke on respiratory mortality is greater at low temperatures. Since extremes of cold and particulate pollution quite frequently coexist, for example during temperature inversion episodes, the results of this study, if corroborated may have public health implications in determining which environmental circumstances pose the highest risk to the health of the public.
Main messages
-
The effects of black smoke on mortality appeared to persist for lag periods in excess of 2 weeks.
-
There was little evidence to suggest that the effect of black smoke on mortality was modified by season (cool and warm periods).
-
There was some evidence of a modest interaction between cold temperature and black smoke in their effect on respiratory and all-cause mortality.
Policy implications
-
The Air Quality Standard setting for the short-term effects of air pollutants may need to take into account particulate pollution over a longer period than in current standards.
-
If replicated in other areas, these results suggest that stricter regulation of particulate air pollution may be required in colder cities, and during periods of colder weather in more temperate cities.
-
Assessment of environmental risks to the health of the public or to susceptible individuals should address potential interactions between pollution and weather.
Acknowledgments
This work was supported by a research grant, number G9900747, from the Medical Research Council to RMA and colleagues. The views expressed in this publication are those of the authors and not necessarily those of the Medical Research Council.
REFERENCES
Supplementary materials
web only appendix 65/3/197
Files in this Data Supplement:
Footnotes
-
Competing interests: None declared.