Article Text

Abstract
Background: Several studies have demonstrated associations between daily mortality and ambient particulate matter less than 2.5 microns in diameter (fine particles or PM2.5). Few, however, have examined the relative toxicities of PM2.5 constituents, including elemental carbon and organic carbon (EC and OC, respectively), nitrates and transition metals. There is also little information about whether associations between PM2.5 constituents and mortality are modified by socioeconomic and demographic factors.
Aim: To examine associations of daily cardiovascular mortality with PM2.5 and its constituents after stratification by gender, race/ethnicity and education, using data from six California counties during 2000 to 2003.
Methods: The association of daily counts of cardiovascular mortality with PM2.5 components was analysed using time-series regression analyses. Poisson models with natural splines were used to control for time-varying covariates such as season and weather. Separate models were run after stratification by gender, race/ethnicity (White, Hispanic, Black) and education (high school graduation or not). Models were run for each county and results were combined using random effects meta-analysis.
Results: Daily counts of cardiovascular mortality were associated with PM2.5 and several of its species including EC, OC, nitrates, sulphates, potassium, copper and iron. For many of these species, there were significantly higher effect estimates among those with lower educational attainment and Hispanic individuals. For example, while essentially no association was observed for individuals who graduated from high school, an interquartile change in several of the components of PM2.5 was associated with a 3–5% increase in daily mortality among non-high school graduates.
Conclusion: There is evidence that several PM2.5 constituents may represent important contributors to cardiovascular mortality. Many of these constituents are generated by motor vehicles, especially those with diesel engines, and by residential wood combustion. In addition, factors associated with low educational attainment may increase susceptibility to PM2.5 and its components.
Statistics from Altmetric.com
Several multi-city time-series analyses have demonstrated associations between daily mortality and ambient fine particulate matter (particles less than 2.5 microns in aerodynamic diameter or PM2.5).1 2 There is limited information, however, about associations of daily mortality with components of PM2.5, such as transition metals and elemental carbon and organic carbon (EC and OC, respectively).3 4 In addition, little is known about such associations among demographically distinct and potentially susceptible subpopulations (eg, different racial groups).
Information on both the toxicity of PM2.5 components and susceptibility of subpopulations may be important for several reasons. First, identification of specific PM2.5 constituents that may be more strongly associated than total PM2.5 mass with mortality would facilitate the targeting of pollution control efforts. Second, in multi-city studies of particulate matter and daily mortality, analyses have demonstrated inter-city heterogeneity.5 Characterising differential population susceptibilities and PM2.5 component toxicities could help explain some of this heterogeneity in terms of differences in physico-chemical composition of particle mixtures and/or demographic characteristics. Third, the substandard health status of economically disadvantaged communities has been well documented,6 7 as has the occurrence of disproportionate air pollution exposures in neighbourhoods with high levels of poverty.8 9 Therefore, residents of these neighbourhoods may be differentially affected both because of locally elevated air pollution exposures and because of poverty-related factors that may enhance susceptibility to pollution, such as poor nutrition and reduced access to quality healthcare.
In this paper, we examined whether gender, race/ethnicity and educational attainment modified relationships between daily mortality and species of PM2.5 in six California counties.
METHODS
Mortality data
We obtained data on daily mortality for all California residents from the California Department of Health Services, Center for Health Statistics (CDHS) from 1 January 2000 to 31 December 2003. Data were limited to deaths occurring in the decedents’ counties of residence. Daily counts of deaths from cardiovascular disease (International Classification of Diseases, Tenth Revision (ICD10) = I00–I99) were calculated and also aggregated for several sociodemographic groups, including males, females, white, Hispanic, and black residents, individuals having less than a high school education and those having at least a high school education. Race and ethnicity were two separate questions in the CDHS mortality database. Our definition of Hispanic was similar to that used by the CDHS, where the coroner or next of kin indicate a positive response to the question of Hispanic ethnicity. A person of any race or races may be of Hispanic origin; approximately 80% of Hispanic individuals were Mexican/Chicano, 10% were Central- or South American, 3% were Cuban and 2% were Puerto Rican. We defined both White and Black by the first race listed, and by an answer to the Hispanic question marked “not Spanish/Hispanic”. Since few associations were observed for black residents, likely due to low count of daily deaths, this subgroup was dropped from subsequent analysis.
Pollutant and meteorological data
We obtained PM2.5 speciation data for the 4-year period 2000 to 2003 from the California Air Resources Board (CARB). The speciation monitors were part of the Special Trend Network and the State and Local Air Monitoring Stations network, and were filter-based Speciation Air Sampling Systems (Met One Instruments Inc., Grants Pass, Oregon). We included only the six counties with 180 days or more observations of PM2.5 species data to enhance statistical power throughout the study period. Each of the six counties had two monitors measuring components of PM2.5. In three counties (Fresno, Kern and Riverside), the two monitors were located within 4 m of each other, while in the other counties (Sacramento, San Diego and Santa Clara) the monitors were not co-located. Fresno, Kern, Riverside and Sacramento counties reported data every third day; San Diego and Santa Clara counties reported data every sixth day. To obtain a daily county pollutant concentration for each species while accounting for missing data, we combined data from the two monitors using the same process as that reported in Ostro et al.3 We included only species for which at least 50% of the observations were above the level of detection.
The following constituents of PM2.5 were measured as 24-hour averages: EC, OC, nitrates (NO3), sulphates (SO4), calcium (Ca), chlorine (Cl), copper (Cu), iron (Fe), potassium (K), sulphur (S), silicon (Si), titanium (Ti) and zinc (Zn). These PM2.5 components represent multiple sources of PM2.5, primarily gasoline combustion, diesel exhaust, wood smoke, crustal material and secondary pollutants.
To adjust for effects of weather, we obtained daily average temperature and humidity data at meteorological stations in each of the counties from the National Climatic Data Center.10
Statistical analysis
Time-series analysis using Poisson regression was used to model mortality for each stratum (eg, women) conditional on the explanatory variables. A similar model specification was used for each stratum and each city, and included the following time-varying covariates: day of the week, natural cubic smoothing splines of time with four degrees of freedom (df) per year of data, and natural splines of 1-day lags of average temperature and humidity (each with 3 df). The df were chosen a priori based on their effectiveness in controlling for seasonal and secular patterns in previous studies.1 11 County-specific estimates were initially obtained for each component using single-day lags of 0 to 3 days. The county-specific results were then combined in a meta-analysis using a random-effects model12 for each of the socio-demographic mortality categories (cardiovascular mortality by gender, race/ethnicity and educational attainment). We tested for statistical differences between strata using a t-statistic.13 We reported basic results for all lags but focused on the results using lags of 0 and 3 days. Unlike many time-series studies with continuous daily data, not all lags refer to the same outcome of days. Specifically, for species data collected every third day, lags of 0 and 3 days will refer to the same days (and numbers of deaths/day). In contrast, for those same PM data, lags 1 and 2 refer to different mortality days. While this phenomenon holds true for other studies using non-daily PM data, the number of observations used in this analysis are small relative to those in most published studies of PM and mortality, so the results may be more sensitive to the mortality days used.
All final results were calculated using R software (version 2.5.0: R Development Core Team). To compare relative impacts based on observed concentrations, the results are presented as the excess risk (ie (relative risk - 1) × 100) in daily mortality for the interquartile range (IQR) of the pollutants.
RESULTS
Tables 1 and 2 provide descriptive statistics for mortality categories, air quality, and meteorological data from six counties with component data. Mean daily cardiovascular mortality ranged from 5.1 deaths in Kern county to 20.3 deaths in San Diego county (table 1). Mean daily PM2.5 concentrations over the study period ranged from 12.6 μg/m3 in Sacramento county to 27.1 μg/m3 in Riverside county (table 1). Four of the six counties exceeded the US EPA annual average PM2.5 standard of 15 μg/m3, and all six exceeded the California annual average standard of 12 μg/m3. As shown in table 2, the four largest components of PM2.5 were EC, OC, NO3 and SO4, which constituted approximately 5%, 37%, 28% and 10% of total PM2.5 mass, respectively. Moderate-to-high correlations (r = 0.4–0.6) were found between PM2.5 and EC, OC, NO3, K and Zn. More modest correlations (r = 0.2–0.4) were observed between PM2.5 and SO4, Ca, Cu, Fe, S and Ti. Between species, correlations generally ranged from 0.20 and 0.45, with a few exceptions such as EC with OC (0.61), Fe (0.48), K (0.48) or Zn (0.53), OC with Zn (0.50), and SO4 with S (0.85) (see Ostro et al, 2007 for a full set of correlations).3 Over the 4 years, there were a total of approximately 1870 observation-days across the six counties for most of the species.
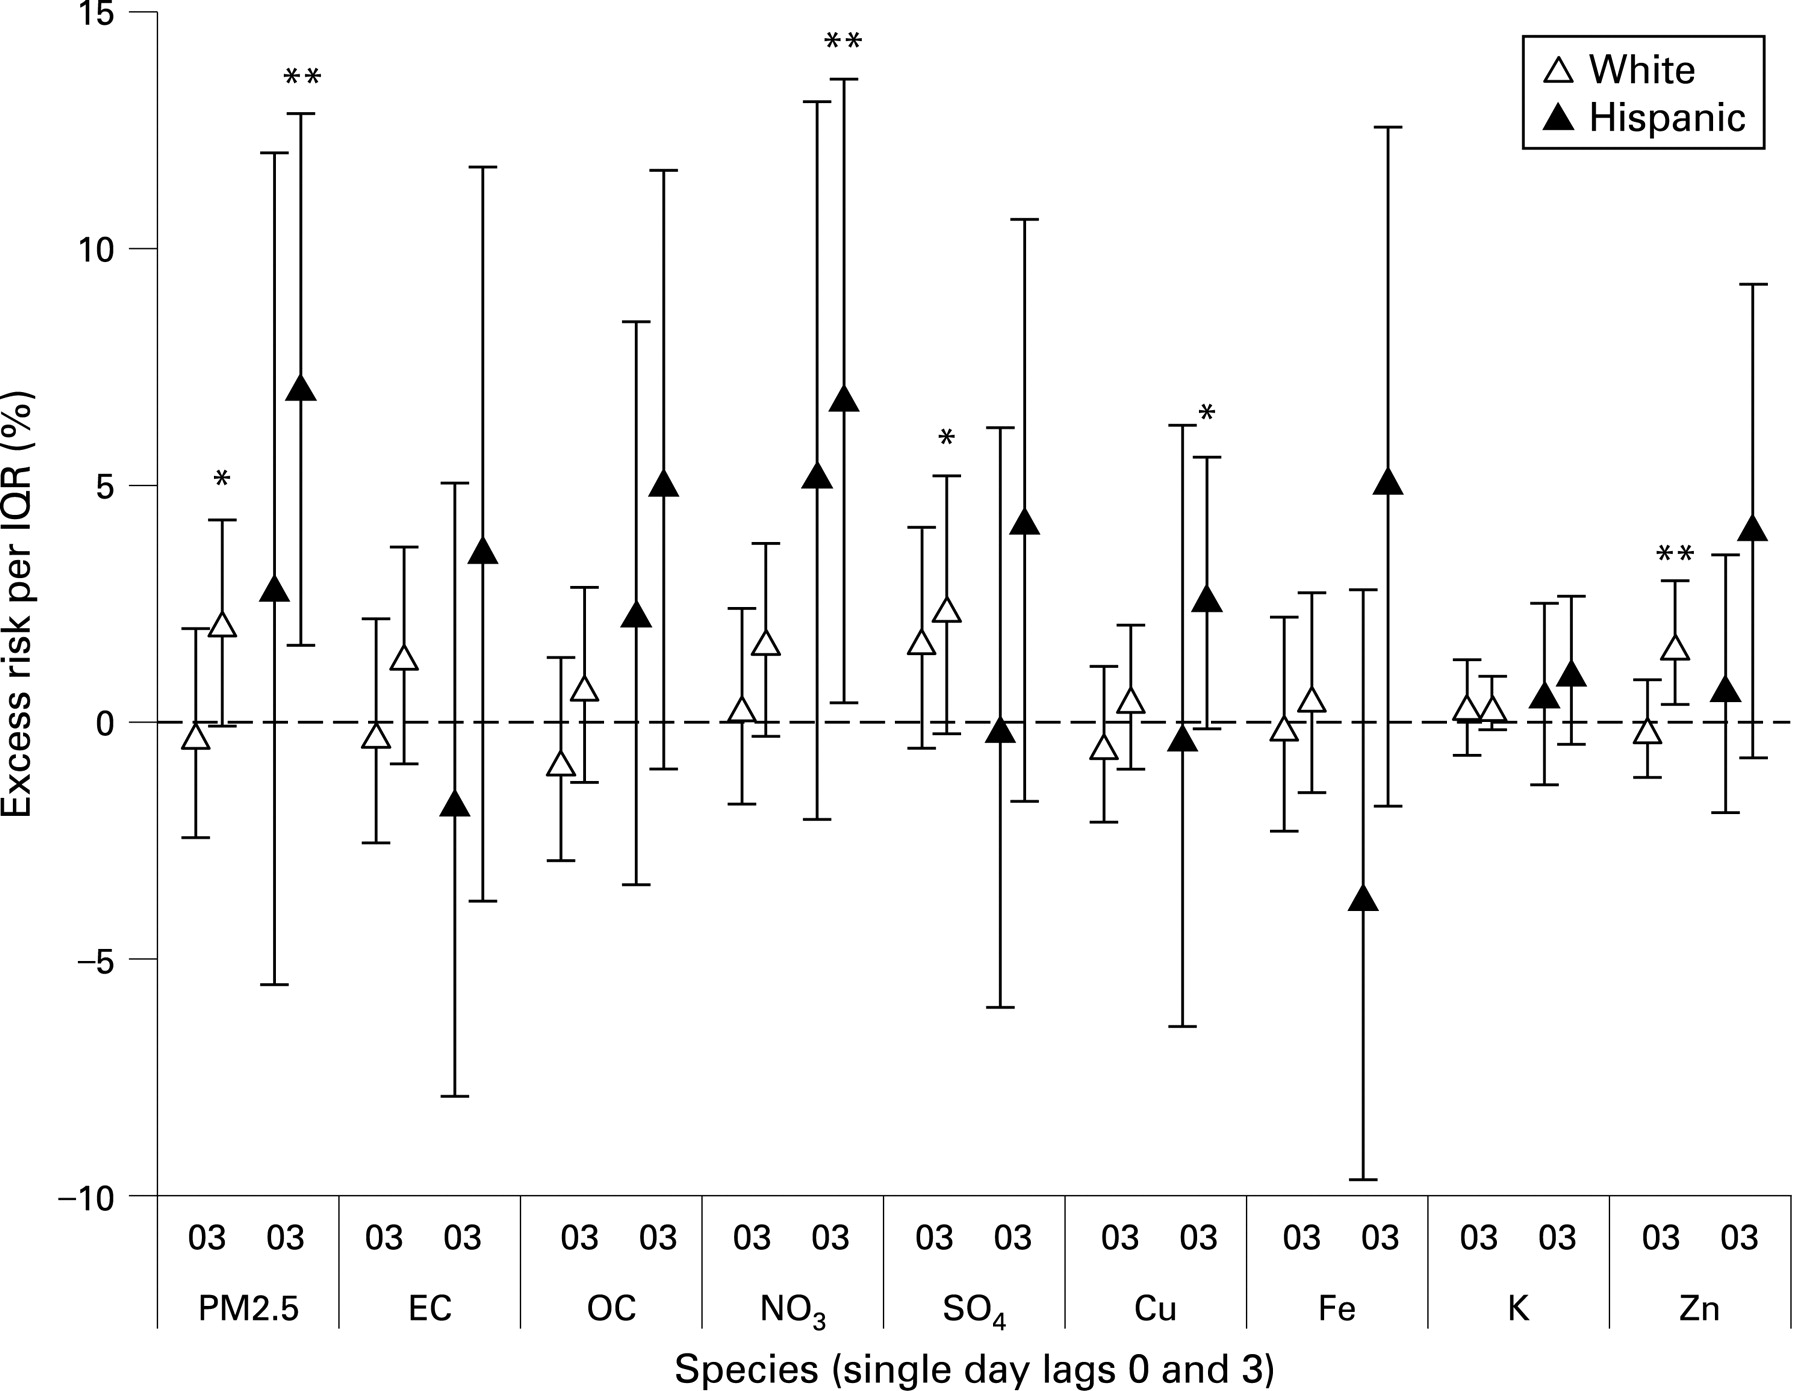
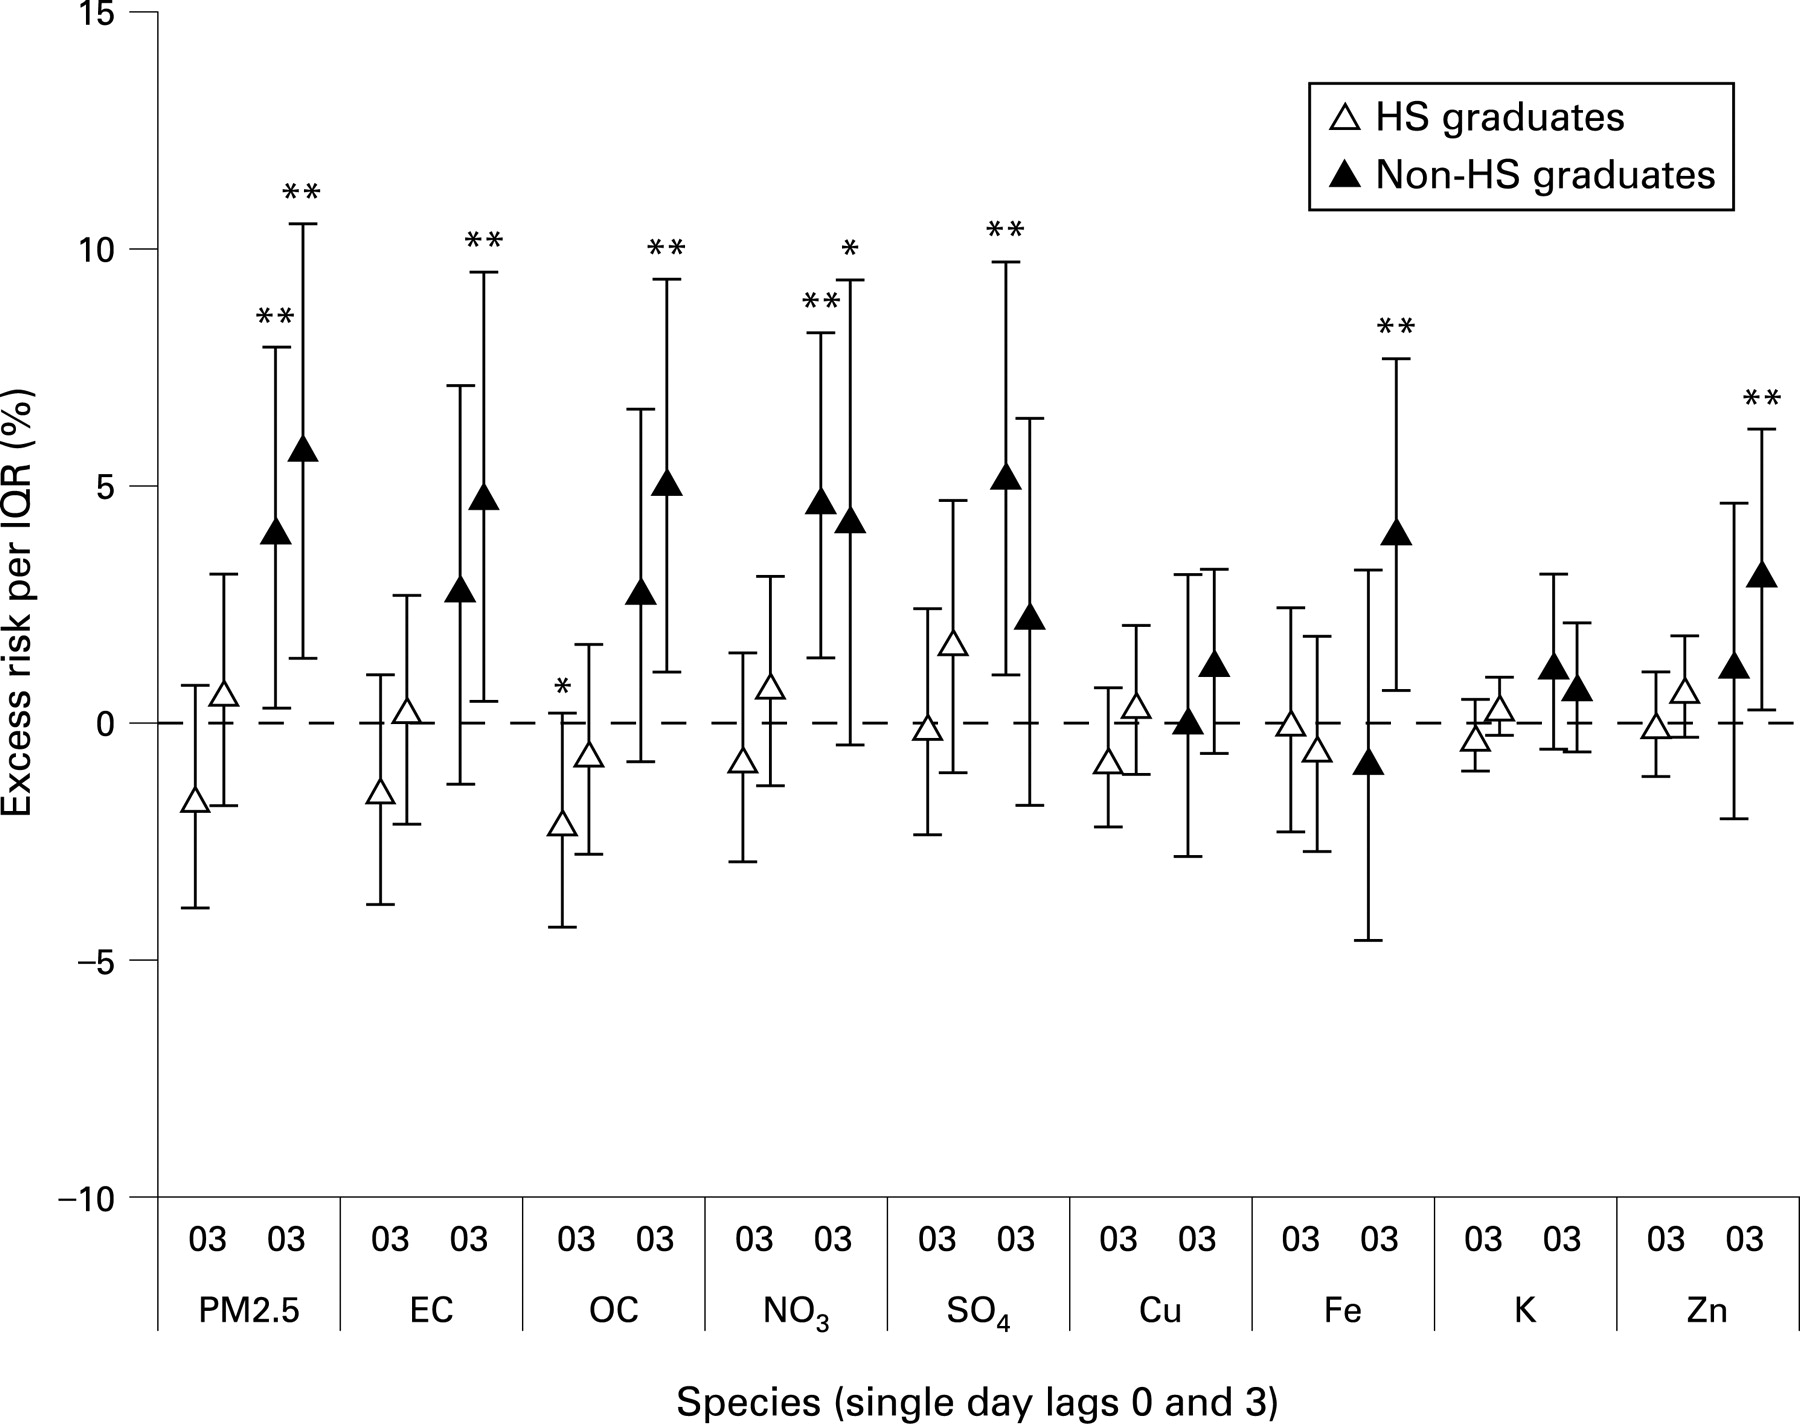
Table 3 summarises the results of the meta-analysis examining cardiovascular mortality in relation to pollutant lags of 0 to 3 days. Positive associations were observed involving various subgroups and lags of several species. Frequent associations were observed for PM2.5, EC, OC, NO3, SO4, Fe, K, S, Ti and Zn. Among the subgroups, many more associations were observed for non-high school graduates. Associations were also more evident for females, and for both white and Hispanic people. Figures 1 and 2 summarise the quantitative meta-analytic risk estimates for cardiovascular mortality for the race/ethnicity and education subgroups. The figures demonstrate that the quantitative differences in excess risks between some of the subgroups are substantial. For example, excess risks for Hispanic people ranged from 2.5 to 6% for many of the species versus 0 to 2% for white people. By education, the differences were even greater. There were essentially no significant associations observed for high school graduates, with statistically significant excess risks of 2–6% among those who have not graduated from high school. The examination by gender indicated few differences in risk for males versus females.


Table 3 also provides a summary of the lags for which there were statistically significant effect estimates between subgroups. For example, for cardiovascular mortality, statistically different risk estimates were observed for non-high school graduates versus graduates for PM2.5, EC, OC, NO3, SO4, Cu, Fe, K, S, Si and Ti. Similarly, statistically significant differences were observed between Hispanic and white people for PM2.5, NO3, SO4, Cl, Cu, K and Ti. Generally similar results were observed for all-cause mortality (data not shown).
DISCUSSION
In this time-series analysis of daily mortality in six counties in California, we detected associations between several components of PM2.5 and cardiovascular mortality. We also found effect modification by several demographic characteristics, including race/ethnicity and education. Specifically, we found large, statistically significant differences in excess risk estimates for Hispanic individuals and for non-high school graduates. These differences in excess risks of mortality were associated with PM2.5 mass and with several fine particulate constituents, including EC, OC, NO3, SO4, Cu, K and others. While some results involving certain species and subgroups appear robust, caution in interpretation is warranted due to the relatively small sample size. Multi-city studies have reported associations between mortality and PM2.5, as well as with its components and several broad source categories.1–3 14 To our knowledge, this is the first study to examine demographic subgroups that may be more susceptible to PM2.5 components. Our findings are generally consistent with previous research, indicating that primary and secondary products of fuel combustion (EC (an indicator of particles from diesel exhaust), OC, SO4 and NO3) and other measures of mobile source-related emissions (Cu, Fe, Ti, Zn), exhibit the strongest and most consistent associations with mortality.
Several recent studies support the biological plausibility of a link between exposure to EC and OC and exacerbations of cardiovascular diseases. For example, Gold et al found associations of black carbon with ST-segment depression, suggesting myocardial ischaemia, among a panel of 24 elderly Boston residents.15 Another recent study examined the relative effects of fine particle components on exercise-induced ischaemia in 45 patients with established heart disease.16 Of the five elements examined (Si, S, Ni, Cl and EC), only EC was associated with ST-segment depression. In a German panel study involving weekly electrocardiograms (ECGs) of 56 men with a history of coronary artery disease, Henneberger and colleagues17 identified several associations of ambient EC and OC (within hours of the ECG recording) with changes in myocardial repolarisation, which could increase the probability of sudden death. Thus, exposures to both EC and OC are associated with a number of indicators that could contribute to cardiovascular disease mortality.
To date, only a few epidemiological studies have examined the relationships of SO4 and NO3 with daily mortality. Most analyses using SO4 have produced positive, and often statistically significant, associations including studies conducted in Santa Clara County, California,18 eight Canadian cities,19 and several urban areas on the East coast and in the Midwest.2 In addition, in a recent effort to compare results from alternative factor analysis methods to estimate the effects of sources of fine particles, the SO4-related factor was most consistently significant in the cities studied.4 In one of the few studies examining NO3, a positive and significant association was detected.18
Particulate metal emissions may be generated from several stages of motor vehicle operations, including fuel combustion, lubrication oil emissions, brake wear and tire dust.20 Existing studies provide evidence of adverse effects for several of these metals. For example, transition metals may generate adverse health consequences based on their potential for producing reactive oxygen species and oxidative stress.21 Elevated levels of Cu, Fe and Zn generated from a steel mill were among PM constituents associated with mortality and morbidity in Utah Valley.22 These elevated levels were associated with in vitro oxidative stress and release of pro-inflammatory mediators by cultured respiratory epithelial cells in aqueous extracts. Huang et al23 found that exposure to a factor including V, Zn and Cu from concentrated ambient particles was associated with an increase in blood fibrinogen. Examining relationships between lung function and both ambient PM2.5 and several metals in a panel of individuals with chronic obstructive pulmonary disease, Lagorio et al24 reported that daily exposures to Zn, Fe and Ni were associated with decrements in both forced vital capacity and forced expiratory volume in 1 s. Our analysis also indicates associations of potassium with cardiovascular mortality (table 3). Particulate potassium is generally considered as a marker of vegetative burning, including residential wood combustion.25 26 In future work, we will use chemical mass balance models to examine associations of particle sources, rather than specific species, with mortality in the six California counties.
We found that for many fine particle species, sociodemographic factors modified the associations of the pollutants with cardiovascular mortality. In particular, we observed greater effect estimates for components of PM2.5 among individuals with lower educational attainment. With some exceptions, similar findings for effect modification by lower educational attainment have been reported in observational mortality studies involving both short- and long-term exposures to particulate matter. For example, in a study of four US cities,27 the daily association of PM10 with total mortality was greater for persons with low education. Effect modification of the pollutant–mortality relationship was also examined in an analysis of the 90 largest US cities.5 In multivariate models that included city average pollution concentrations of PM10 and nitrogen dioxide, the percentage of the population that had not graduated from high school, was associated with higher city-specific effect estimates. In a study of 20 cities, most from the eastern United States, Zeka et al28 examined associations between PM10 and daily mortality for various sociodemographic strata, including gender, race and education. For deaths from cardiovascular disease, the PM10 effect estimate was greater for black versus white individuals, and for non-high school graduates. A study in Rome, Italy29 demonstrated that the association of PM10 with mortality was most pronounced among those of lower socioeconomic status (SES).
Support for effect modification by SES is also provided by time-series studies of hospitalisation. For example, associations between air pollution and respiratory admissions in New York City and Los Angeles were stronger among Medicaid and MediCal (California’s equivalent of Medicaid) recipients than among privately insured individuals.30 31 Lower educational attainment also appears to be an important effect modifier in several cohort studies that have examined associations of longer-term exposure to particulate matter with mortality.32 Thus, the evidence to date from studies of both short- and long-term exposure suggests that there may be a greater effect of PM among individuals from lower SES groups.
Although the specific risk factors are unknown, plausible candidates include poor nutrition, differential exposure patterns,8 33 34 greater prevalence of co-morbidities and/or various factors related to poverty, including lower access to and use of healthcare.35–37 In the USA, lower income and educational attainment are associated with both more cardiovascular events (eg, nonfatal myocardial infarction, nonfatal ischaemic stroke, cardiovascular death and coronary revascularisation) and higher levels of cardiovascular risk factors (eg, body mass index, hypertension, diabetes and blood lipid levels).38 In the six California counties studied, almost 50% of Hispanic individuals aged ⩾25 did not graduate from high school, versus 25% for the black population and 12% for the white population.39 Data from the nationwide Behavioral Risk Factor Surveillance System (BRFSS), an ongoing random-digit dialling telephone survey conducted monthly within each state and compiled by the US Centers for Disease Control and Prevention (CDC), show disparities in health behaviours by ethnicity and education.40 41 In 2004, respondents with less than a high school education from all states combined, were more likely than those with at least a high school education to report current smoking, physical inactivity and obesity. Results of the 2001 BRFSS for California showed that non-Hispanic black and Hispanic participants had higher rates of obesity (33.9% and 29.0%, respectively) than non-Hispanic white participants (20.2%). Hispanic participants had the highest prevalence of no leisure-time activity and binge drinking, while non-Hispanic black participants had the highest prevalence of current smoking (23.2%), followed by 17.4% for white participants and 16.0% for Hispanic participants.
As has been the case in other studies, we failed to find consistent evidence for pollutant effect modification by gender. For example, in a study of emergency visits for myocardial infarction in 21 US cities, Zanobetti and Schwartz found that effect size for PM10 for males was almost double that of females.42 However, in a study of PM10 and mortality in four large US cities, Zanobetti and Schwartz found that the effect estimate linking PM10 with female deaths was greater than that for males.27
Our analysis is subject to several limitations. First, the dataset is relatively small, with only about 350 observations per county over a 4-year period. This increases the likelihood of both Type II errors due to low statistical power and Type I errors from stochastic variability with small numbers. These possibilities are somewhat reduced by the use of six counties in the meta-analysis, but the results may still be sensitive to the sampling period; different findings might result from the analysis of larger datasets. For example, in a previous analysis of PM2.5 and mortality,1 we found generally similar effect estimates for Hispanic individuals versus white individuals. Consistent with our current findings on PM2.5 constituents, however, our previous study found that for all-cause mortality, the effect estimates for non-high school graduates were more than twice those of high school graduates. A second limitation involves the issue of causality. While some PM2.5 constituents are clearly toxic in a variety of studies (eg, EC), others have less intrinsic toxicity at low levels of exposure (eg, K). Therefore, to the extent that the associations we observed represent causal relationships, the effect of any single PM2.5 component may be due to that component’s intrinsic toxicity or from its covariation with other, more toxic substances. Third, the components have differential measurement error owing to differences in the instrumental accuracy and in spatial variability, both of which could bias the resulting effect estimates and standard errors. We also examined the possibility that the apparent effect modification could be due to differences in exposure misclassification. Specifically, if pollution monitors were consistently located in neighbourhoods with high percentages of Hispanic people and individuals who had not graduated from high school, it is possible that these groups would have lower exposure misclassification and greater pollutant-associated effect estimates (assuming the existence of a causal relationship). We first examined the proportion of these subgroups living within 5 km of the monitors in each county, and compared that to the proportion of the subgroup in the county as a whole. We then limited our meta-analyses to counties where Hispanic people and less-educated populations were not overrepresented near the monitors, and still found greater effect estimates in those subgroups. It is therefore reasonable to conclude that potential differential exposure misclassification had little impact on the observed results.
Our findings provide additional evidence linking daily mortality with combustion-associated particulate matter, as indicated by increased effect estimates for PM2.5 species such as EC, OC, NO3, K and several metals, including Cu, Fe and Zn. The results also suggest the possibility of increased susceptibility to PM2.5 among specific demographic subpopulations, as signalled by elevated effect estimates for those with less than a high school education and for Hispanic people.
Acknowledgments
The opinions expressed in this paper are solely those of the authors and do not represent the policy or position of the State of California or the California Environmental Protection Agency.
REFERENCES
Footnotes
-
Competing interests: None.