Article Text

Abstract
This study describes the short-term relationships between the daily levels of PM10, PM2.5, NO2 and the number of doctors’ house calls for asthma, upper respiratory diseases (URD) and lower respiratory diseases (LRD) in Greater Paris for the years 2000–3. Doctors’ house calls are a relevant health indicator for the study of short-term health effects of air pollution. Indeed, it is potentially more sensitive than indicators such as general hospital admissions due to the severity of diseases motivating the call. In this study, time-series analysis was used. The daily numbers of doctor’s house calls were adjusted for time trends, seasonal factors, day of the week, influenza, weather and pollen. Up to 15 days of lag between exposure and health effects was considered using distributed lag models. A total of about 1 760 000 doctors’ house calls for all causes occurred during the study period, among which 8027 were for asthma, 52 928 for LRD and 74 845 for URD. No significant increase in risk was found between air pollution and doctors’ house calls for asthma. No significant association was found between NO2 and doctors’ house calls. An increase of 10 μg/m3 in the mean levels of PM10 and PM2.5 encountered during the 3 previous days was associated with an increase of 3% (0.8% and 5.3%) and 5.9% (2.9% and 9.0%) in the number of doctor’s house calls for URD and LRD, respectively. Considering up to 15 days between exposure and health outcomes, effects persist until 4 days after exposure and then decrease progressively. No morbidity displacement was observed. This study shows a significant heath effect of ambient particles (PM2.5 and PM10). When compared to the RRs obtained for mortality or hospital admissions in the same area, the values of the RRs obtained in this study confirm the higher sensibility of doctor’s house calls for respiratory diseases as a health indicator.
- GP, general practioners
- LRD, lower respiratory diseases
- NO2, nitrogen dioxide
- URD, upper respiratory diseases
Statistics from Altmetric.com
- GP, general practioners
- LRD, lower respiratory diseases
- NO2, nitrogen dioxide
- URD, upper respiratory diseases
Many studies report effects of air pollution on mortality1,2 or hospital admissions.3,4 These effects were found for non-specific mortality, and cause-specific mortality or morbidity (respiratory and cardiovascular).
Over the past decade, there were fewer studies concerning the impact of air pollution on primary care setting. Recently, Hajat et al5,6 and Hwang et al7 have demonstrated that air pollution affects daily counts of general practice consultations. Earlier studies have examined the effects of air pollution on home medical visits.8,9
Among the health effects of air pollution, respiratory diseases have been widely studied: respiratory organs are the first ones encountered by pollutants when air is inhaled. What is more, toxicological studies have shown that both gaseous and particulate air pollutants could trigger local responses in terms of inflammation or oxidative stress.10 In particulate air pollution, the aerodynamic size of the particles plays a role in their toxicity: the smaller ones are more capable of reaching the lower parts of the respiratory tract. For this reason, it seems relevant to consider both PM10 (particles of aerodynamic diameter <10 μm) and PM2.5 (particles of aerodynamic diameter <2.5 μm).
The present study was part of the ERPURS programme (Evaluation des Risques de la Pollution URbaine sur la Santé), initiated by the Regional Council, Paris, France, in December 1990. The goal of this programme is to examine the short-term associations between air pollution and health. In a previous study of this programme, the effects of air pollution on doctor’s house calls had already been examined.11 The authors found significant short-term relationships (taking up to 3 days of lag between exposure and health event into account) between several air pollution indicators (black smoke, PM13, SO2 and NO2) and doctors’ house calls for asthma. These relationships were stronger for children. In this previous study, the authors could not examine the associations between air pollution and doctors’ house calls for upper respiratory diseases (URD) or lower respiratory diseases (LRD), due to an important overdispersion in the data. In the present study, we look at the short-term links between gaseous (nitrogen dioxide (NO2)) and particulate (PM10 and PM2.5) air pollution indicators and, doctor’s house calls for asthma, URD and LRD for the years 2000–3 in Greater Paris. As several authors have studied the lags between exposure and response in terms of mortality12 and hospital admissions,13 and found that effects could be distinguished up to 10 days after exposure, we also study the lag between exposure and response up to 15 days.
MATERIAL AND METHODS
Study area
Exposure and health data were obtained for the same geographical zone: Paris and the three surrounding departments Hauts-de-Seine, Seine-Saint-Denis and Val-de-Marne, which constitute the Greater Paris area.
Health outcomes
SOS-medecins Paris is an association of general practioners (GPs). It counts about 165 GPs who make home medical visits 24 h a day, 7 days a week. Patients in need of a home medical visit, when their usual GP is not available, can request through a phone call to the association. Each call is logged, and the complaints, symptoms and infections reported by the patient are coded according to the International Classification of Primary Care 2. After the call, a doctor sees the patient as soon as possible, on the day of the call. For the purpose of our study, the data included the number of daily doctors’ house call for asthma, URD and LRD (table 1). The definition of health indicators was established in order to be able to compare the results with those obtained in a previous study of the ERPURS programme,11 using the same source of data.
Health indicator and classification
Air pollution data
Daily air pollution data for the period 2000–3 were obtained from the Greater Paris air pollution network Airparif. Particulate matter was measured as PM10 (particulate matter with aerodynamic diameters <10 μm) and PM2.5 (aerodynamic diameters <2.5 μm) in multiple monitoring stations (between seven and nine sites were available for PM10 during the study period and between one and four sites for PM2.5). NO2 concentrations were obtained from 12–15 stations. All these stations were urban background-monitoring sites that were not directly submitted to local sources of air pollution (traffic or industrial). Variations in day-to-day levels recorded in these background-monitoring stations are considered as representative of mean variation from day-to-day exposure levels of people living in Greater Paris. For each pollutant, the values measured by these stations were highly correlated and were close to the ones measured by the other stations (correlation coefficient > 0.6, 75th centile of the distribution of the values recorded by a station higher than the 25th centile of the distribution of the values recorded by the other stations). The number of missing values over the entire study period varied between 2% and 24%, depending on the pollutant and the monitoring station. These missing values were randomly distributed over time. PM10 and PM2.5 concentrations were measured by Tapered Element Oscillating Microbalance and NO2 concentrations by chemiluminescence. Daily exposure indicators were calculated, for each day of the period 2000–3, as the arithmetic mean of the daily mean concentrations recorded by each station. When possible, missing values were estimated following the Air Pollution and Health: a European Approach 2 methodology.14 As PM2.5 was measured in only one site during the first part of the study period, missing values could not be replaced during this period.
Other environmental data
Meteorological data were collected by Meteo-France city, country. Minimal temperature, maximal temperature and minimal relative humidity were obtained from one monitoring site. Pollen data were provided by the French surveillance system for pollen counts (Réseau national de surveillance aérobiologique). The pollen types considered were selected according to their importance in Greater Paris, and to their allergenicity. Finally, plane tree, grasses, birch and ash tree were considered for the analysis. Data on influenza epidemics were obtained from the regional network for influenza monitoring (Groupe régional d’observation de la grippe). These data are indicated for each week whether it was epidemic or not.
Statistical analysis
Time series analyses were conducted using generalised additive models with parametric smoothers (penalised splines) to control for non-linear effects.15,16 The daily number of calls for URD, LRD or asthma was Poisson distributed, and they showed an overdispersion over the mean. For this reason, a quasi-Poisson distribution, to take into account the overdispersion, was used in the generalised additive model. As a control for long-term trends and seasonality, a penalised spline function was used. Similar functions of temperature and humidity, recorded on the days of the calls and up to 3 days before the calls, were introduced in the model. Smooth functions of daily counts of pollens were also introduced in the model. Different methods of modelling influenza epidemics were compared:17
-
introduction of a dummy variable (epidemic period or not)
-
introduction of a dummy variable for each epidemic period
-
introduction of a specific smooth function for each epidemic period.
Dummy variables for days of the week, holidays and bank holidays were included as other independent variables.
The final step was the introduction of pollutant levels in the model.
In the study of very short-term effects of air pollution, pollutant levels of the current day and up to 3 days before were tested (lags 0, 1, 2, 3). Mean levels of the current day and the previous 1, 2 or 3 days were also examined (lags 0–1, 0–2 and 0–3).
Presumably, the health impact of an increase in pollutant levels may appear with some latency, and may persist for some time after exposure. To describe this lag between exposure and response, distributed lag models were used.18–20 For the study of delayed effect of air pollution exposure, meteorological variables were controlled for 3 days. As a sensitivity analysis, we conduced the same analysis as a control for the weather of 15 previous days.
For each health outcome (asthma, URD and LRD), lags (for meteorological and air pollution variables), degree of smoothing for spline smoothers and taking influenza epidemics into account were chosen to minimise Akaike’s Information Criterion and autocorrelation in the residuals. The degree of smoothing was also determined using graphical representation of terms effects. All statistical analyses were carried out using the R software.21
The increase in relative risk (RR) of calls associated with an increase in pollutant levels was calculated.
RESULTS
The study area included Paris and the three surrounding departments (Hauts-de-Seine, Seine-Saint-Denis and Val-de-Marne), representing a total area of 762.24 km2. The population of this area in 1999 was estimated to be 6 174 000 inhabitants. Among the persons living and/or working in Greater Paris area, 69.2 % live and work there. 9.3% of the people living in this area do not work there and 25.4% of the people who work in this area do not live there.22 It is a densely populated urban area, concentrating a lot of transportation infrastructures: highways, roads, railway and two international airports located at the outskirts of this area. In this area, NO2 and particular air pollution levels have been relatively constant during the study period.
Table 2 shows the descriptive statistics of the environmental variables: air pollutants, minimal and maximal temperature, as well as minimal relative humidity. As expected, the 24 h levels were higher for PM10 than for PM2.5. A very high correlation was found between the daily levels of these two particulate air pollution indicators (Pearson’s coefficient: 0.95). The daily levels of PM10 and PM2.5 were also correlated to the daily levels of NO2 (Pearson’s coefficient: 0.68). Table 2 also shows the descriptive statistics of the daily number of doctors’ house call for asthma, URD and LRD during the 4-year period that was analysed (2000–3). A total of about 1 760 000 doctors’ house calls for all causes occurred during the study period, among which 8027 were for asthma, 52 928 for LRD and 74 845 for URD. The median number of daily doctors’ house calls is quite large for URD (45), whereas it is very low for asthma (5). The daily number of doctors’ house calls for URD and LRD were highly positively correlated (Pearson’s coefficient: 0.95). The age distribution of the callers varied depending on the health indicator. In total, 20.7% of the people who called for asthma (38.4% for URD and 48.5% for LRD) were children aged <15 years and 12.6% (2.3% for URD and 5.5% for LRD) were older people aged ⩾ 65 years.
Summary statistics of the daily counts of doctors’ house calls, daily concentrations of air pollutants and other environmental data (2000–3)
Specific statistical models were constructed for each health indicator. When the relationship between air pollutants levels and the daily number of doctors’ house calls was studied, for each health indicator, the best statistical model was obtained with the pollutant levels averaged over the current days and the three previous days (lag 0–3). After a visual examination of the concentration–response curve obtained with a smooth function of the pollutant levels (fig 1), we found it reasonable to assume that a linear relation existed between the levels of pollutants and the number of doctors’ house calls. When compared with the use of a smooth function, the use of a linear relation reduced the Akaike’s Information Criterion and did not modify the part of the deviance explained by the model. Minimal temperature and minimal relative humidity were also included in the model as mean levels over the current day and the three previous days (lag 0–3). Each epidemic period was introduced in the model as a dummy variable. Only for asthma, the daily counts of some pollens (birch) were kept in the model.

Exposure–response curve for PM2.5 and doctors’ house calls for URD using a penalised spline function (2,7 degrees of freedom): RR of doctors’ house calls for URD at various PM2.5 concentrations.
Table 3 presents the results obtained in terms of risk increases. Risk increases are presented for a 10 μg/m3 increase in NO2, PM2.5 and PM10 levels. No significant risk increase was found for asthma house calls. No significant association was found between NO2 and house calls for any of the indicators studied. Significant risk increases were found for URD and LRD in association with PM10 and PM2.5. For a similar increase in air pollutants level, these associations were stronger with PM2.5 than with PM10. As a sensitivity analysis, only non-imputed air pollution data were used to calculate the risk excess. No significant differences were observed for both the central estimate and the confidence interval.
Risk excess for house calls for asthma, upper and lower respiratory diseases following a 10 μg/m3 increase in NO2, PM2.5 and PM10 levels (lag 0–3)
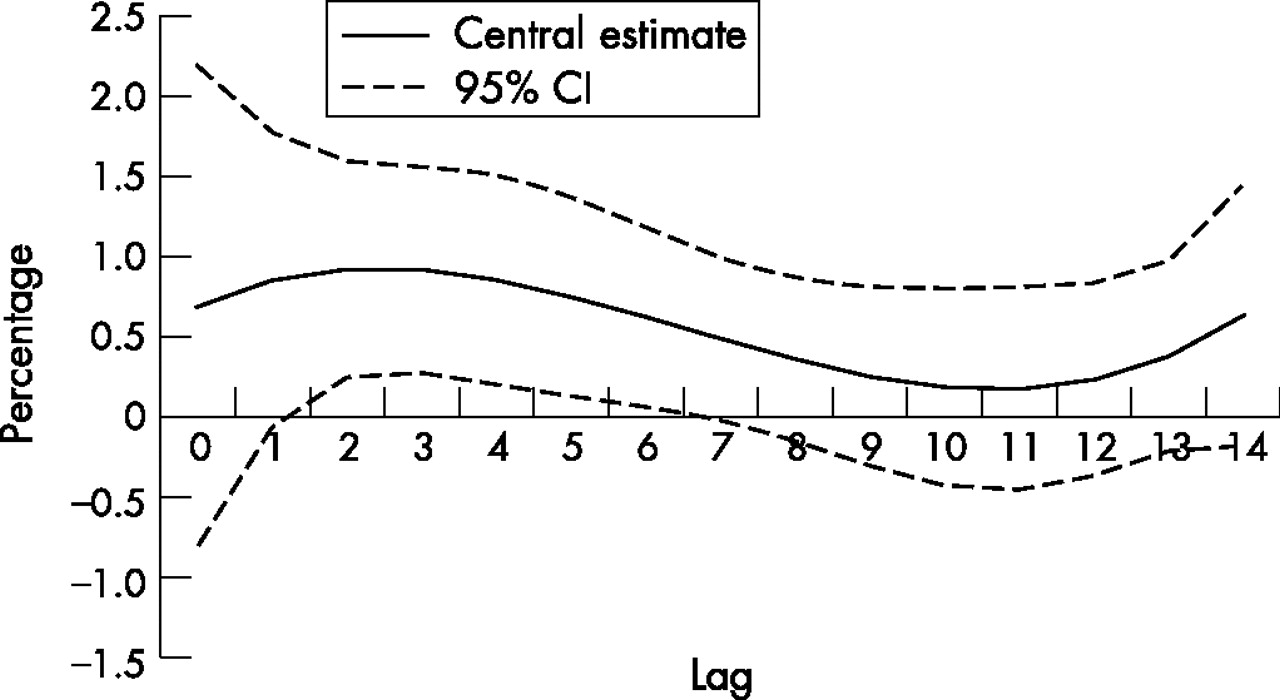
As no association was found between NO2 and the number of doctor’s house calls, and between asthma and the levels of pollutants taking up to 3 days into account between exposure and health effects, we did not look at lags over 3 days for these indicators. Distributed lags models could not be used for PM2.5 due to a large number of missing values. Hence, only PM10 in relation with upper and LRD was studied. Figure 2 shows the results for the distributed lag models. Up to 15 days of lag between the exposure and the health effects were considered. Taking into account lags over 3 days revealed larger effect estimates. Over 15 days, the overall effects of 10 g/m3 increase in PM10 levels were a risk increase of 8.7% (95% CI 5.0 to 12.5) for LRD and a risk increase of 4.9% (95% CI 1.1 to 9.0) for URD. According to fig 2, effects of PM10 persist until 4 days after the exposure, and then decrease progressively. No negative effects were observed within the 15 days considered here.
Estimated shape of the association of PM10 for each lag with daily number of doctor’s house calls for lower respiratory tract diseases (percentage increase in number of calls associated with a 10 μg/m3 increase in PM10). Dotted lines represent 95% CIs.
When we controlled for the weather of the previous 15 days in the analyses, the overall effects of a 10 μg/m3 increase in PM10 levels were non-significantly higher than when controlling for the weather of the previous 3 days. A risk increase of 10.5% (95% CI 6.7 to 14.4) for LRD and 6.3% (95% CI 2.4 to 10.3) for URD were observed.
DISCUSSION
The present study analysed the effects of daily levels of air pollutants on the RR of house calls for asthma, URD and LRD. Our results show a significant association between levels of ambient particles (PM2.5 and PM10) and risks of doctors’ house calls for URD and LRD. A lack of association between ambient particles levels and doctors’ house calls for asthma was observed. No association was found between NO2 and doctors’ house calls.
In this study, one potential bias may originate in exposure misclassification. Exposure was assessed using a global indicator, constructed for the whole population living in the study area, using the levels of pollutants in the outdoor air recorded by the background-monitoring stations. It is well known that such an exposure indicator is not representative of the diversity of individual exposures, which vary according to time–activity patterns. However, this study links the day-to-day variation of this global exposure indicator to the day-to-day variations of the number of doctor’s house calls. The study area was designed in order to ensure the homogeneity of background air pollutants levels, and data22 show that 70% of the workplaces of people living in this area are located within the same area. In this situation, it has been shown that the temporal variations of the mean of individual exposures to particulate matter are well correlated with the temporal variations of a global exposure indicator such as the one used in the present study.23–26 However, this correlation is lower for NO2.26,27 This may represent a non-directional bias that could be partly responsible for the large uncertainties surrounding the estimates of the RRs associated with NO2 in the present study.
During the first 18 months of the study period, exposure to PM2.5 was assessed using only a single monitoring station. However, we checked that during the period when more PM2.5 monitoring stations were available, the levels recorded by this single central monitoring station were highly correlated with the levels recorded by the other monitoring stations (r>0.95).
Another potential source of misclassification bias may arise from the fact that the condition(s) motivating the call for a doctor was recorded according to the patient’s declarations on phone. However, in this study, conditions are brought together into large groups that are certainly less sensitive to this kind of bias.
A previous study in Greater Paris using the same source of data as an health indicator11 and studying its links with several exposure indicators (PM13, black smoke, NO2, ozone, SO2) could not examine the association between air pollution and doctors’ house calls for URD and LRD due to significance overdispersion in the data. Nevertheless, significant short-term links between NO2, PM13 and asthma were found. In the present study, black smoke could not be used anymore as an air pollution indicator, due to the lack of monitoring stations at the end of the study period (2000–3). Sulphur dioxide levels in Paris metropolitan have been decreasing during the past few years, and they were very low during the study period (2000–3). Ozone is a secondary air pollutant, whose levels and chemistry are influenced by many factors. For these reasons, the analysis of its links with doctors’ house calls requires a somewhat different approach, which is the subject of ongoing work. The lack of statistically significant association for asthma during the period 2000–3 may be due to the smaller number of doctors’ house calls for asthma recorded during this period (daily mean: 5.49 doctors’ house calls). The small number of doctors’ house calls for asthma could be explained by the fact that doctors by phone cannot distinguish asthma from dyspnoea/shortness of breath and cough. As a consequence, the calls made by subjects who reported already having asthma were classified as asthma, whereas the others could be put into R02 and R05 codes. Moreover, asthma treatment has changed since 1996, and the context of crisis that motivates doctors’ house calls might have been modified as a consequence.
The results obtained here are in line with the ones found in other studies. In Taiwan, Hwang et al7 found a positive association between daily levels of air pollution (NO2 and PM10) and the daily number of clinic visits for lower respiratory tract diseases. Hajat et al5 observed significant effects of air pollution (NO2 and PM10) on GPs consultations for URD in London for several age groups. However, Hajat et al. 6 reported no significant association between NO2, PM10 and consultations for asthma, and between NO2 and consultations for LRD. For NO2, it is difficult to assess with any certainty whether this pollutant by itself has adverse respiratory effects at ambient levels, since NO2 is one component of a complex mixture emitted by traffic.28 Although NO2 levels have been relatively steady during the study period, the variability over time of the mixture emitted by traffic could lead to changes in the association between NO2 levels and health outcomes across the study period, thus inducing an important variability in the estimated association.
In our study, the effect estimates were consistently larger for PM2.5 than for PM10. This result may be considered as an indication that the finest particles are more harmful to human health. This agrees with the meta-analysis by Ward and Ayres,29 showing that for children, PM2.5 effects on peak expiratory flow were greater than PM10 effects. Choi et al30 experimentally compared the health effect of ambient PM2.5 and PM10 levels and showed greater effect for PM2.5 than for PM10. In particular, they suggested that PM2.5 induced more oxidative stress than PM10. In the same way, Dreher et al31 observed different chemical compositions in PM2.5 and PM10, and reported that PM2.5 contains more heavy metals than PM10. Also, PM2.5 are able to penetrate deeper into the respiratory tract than PM10.
When considering the results concerning the associations between daily levels of PM10 and several health indicators (mortality or hospital admissions) in Greater Paris,32,33 the effects found while considering primary care setting were stronger. An increase of 10 μg/m3 in the mean levels of PM10 was associated with an increase of 0.9% (−1.2%; 3.9%) in the risk of respiratory mortality, an excess risk of 0.9 % (0.1%; 1.7%) was observed for respiratory hospital admissions. Not surprisingly, health indicators corresponding to less severe health effects show a stronger relationship with air pollution levels.
Taking into account up to 15 days of delay to evaluate the effect of PM10, we found that there was an increase in the estimated effect: over 15 days, a 10 μg/m3 increase in PM10 levels was associated to an overall 8.7% increase in RR for LRD and a 4.9% increase in RR for URD. The effects of PM10 were spread over many days, and no negative effect was observed within the 15 days. This means that the people who called were not expected to call within 15 days if no increase in pollutants levels had been observed. This result may be considered as an indication that pollution does not only affect the most frail people and that effects of PM10 on health do not correspond to short-term morbidity displacement. This is consistent with the results of other studies. For example, Schwartz13 also observed no harvesting effect (taking into account up to 60 days of lag) in the relationship between PM10 levels and cardiovascular or respiratory hospital admissions.
Goodman et al34 suggested that the effect of temperature on respiratory mortality extends beyond several weeks after exposure. In the present study, taking the temperature of the 15 previous days into account as a confounding factor in the analysis did not significantly modify the relative risk estimates.
This study, using health indicators originating from primary care setting, contributes to the growing body of evidence concerning the non-lethal health effects of particulate air pollution.
Acknowledgments
This research was supported by Conseil Régional d’Île-de-France. The authors thank suppliers of data: SOS-Médecins Paris, Météo-France, Groupe régional d’observation de la grippe (GROG)-Open Rome, Réseau national de surveillance aérobiologique (RNSA), and Surveillance de la qualité de l’air en Île-de-France (Airparif). The authors are grateful to Dr Cassadou S, Dr Medina S, Le Tertre A (Institut de veille sanitaire), Professor Festy B (Association pour la prévention de la pollution atmosphérique), Lameloise P (Airparif), Le Moullec Y (Laboratoire d’hygiène de la Ville de Paris), Professor Momas I (Faculté de médecine de Paris V), who critically reviewed the study proposal.
REFERENCES
Footnotes
-
Published Online First 21 November 2006