Article Text

Abstract
Background: It has previously been reported that the risk of ventricular arrhythmias is positively associated with ambient air pollution among patients with implantable cardioverter defibrillators (ICD) in Boston.
Aims: To assess the association of community exposures to air pollution with ventricular arrhythmias in a cohort of ICD patients in metropolitan St Louis, Missouri.
Methods: ICD detected episodes reported during clinical follow up were abstracted and reviewed by an electrophysiologist to identify ventricular arrhythmias. A total of 139 ventricular arrhythmias were identified among 56 patients. A case-crossover design was used with control periods matched on weekday and hour of the day within the same calendar month. Conditional logistic regression models were adjusted for temperature, barometric pressure, and relative humidity in the 24 hours preceding the event.
Results: There was a significant (24%, 95% CI 7% to 44%) increase in risk of ventricular arrhythmias associated with each 5 ppb increase in mean sulphur dioxide and non-significantly increased risk (22%, 95% CI −6% to 60%; and 18%, 95% CI −7% to 50%) associated with increases in nitrogen dioxide (6 ppb) and elemental carbon (0.5 μg/m3), respectively in the 24 hours before the arrhythmia.
Conclusions: These results provide evidence of an association between ventricular arrhythmias and ambient air pollutants in St Louis. This is consistent with previous results from Boston, although the pollutants responsible for the increased risk are different.
- air pollution
- epidemiology
- ventricular arrhythmia
- implantable cardioverter defibrillator
- case-crossover
Statistics from Altmetric.com
Episodes of particulate air pollution have been associated with increased hospital admissions for cardiovascular disease1–9 and cardiovascular mortality.10–16 Short term (hours to days) ambient air pollution has been associated with decreased heart rate variability (HRV) in many,17–25 but not all studies.26 This suggests that air pollution adversely affects cardiovascular function, in part, through disturbance of autonomic tone.
Implantable cardioverter defibrillators (ICD) are designed to detect and treat life threatening ventricular arrhythmias. They are implanted under the skin, with electrodes attached transvenously to the heart, where they monitor heart rhythm. On detecting a ventricular rate above a programmed value, they can initiate pacing and/or shock therapy to restore normal rhythm. The electrogram, beat-to-beat intervals immediately preceding, during, and after the event, and the date/time of each event are recorded by the ICD and regularly downloaded during clinical follow up. This feature makes the ICD a useful tool to investigate the association between acute air pollution exposures and incidence of ventricular arrhythmias in epidemiological studies.
Three previous studies have assessed the association between ambient air pollution and ventricular arrhythmias detected by ICDs.27–32 A pilot study of 100 ICD patients in Boston found an association between ICD recorded discharges and mean nitrogen dioxide concentration in the previous two days.27 A follow up study of confirmed ventricular arrhythmias in approximately 200 Boston ICD patients found increased risks associated with two calendar day mean nitrogen dioxide, fine particle mass <2.5 µm in aerodynamic diameter (PM2.5), black carbon, carbon monoxide, ozone, and sulphur dioxide.28,29 A case-crossover analysis of the same study population found significant 19% and 21% increases in risk associated with 7.8 µg/m3 and 15.8 ppb increases in 24 hour moving average PM2.5 and ozone concentrations, respectively.30 In contrast, a study of 50 patients in Vancouver, Canada found no consistent relationships between days with ICD discharges and daily ambient air pollution.31,32 This difference in response among ICD patients in the Boston and Vancouver studies may be due to differences in the cities’ pollution mixes.
In 2001, an intensive air pollution monitoring programme in East St Louis, Illinois (∼4 km east of St Louis, Missouri) was undertaken to provide physical and chemical measurements of air pollutants for health effects, atmospheric science, and regulatory purposes in a setting representative of the urban Midwestern United States.33 In conjunction with this intensive air pollution monitoring, we conducted a prospective study to assess the association of community air pollution and ventricular arrhythmias in ICD patients residing in the St Louis metropolitan area.
METHODS
Study population
ICD patients followed clinically at the Barnes Jewish Hospital, Washington University in St Louis, Missouri between 9 May 2001 and 31 December 2002 were eligible for participation in the study. Subjects whose ICD detected a ventricular arrhythmia since their last clinic visit were recruited into the study, and informed consent was obtained for review of their records. Subjects with residential zip codes greater than 40 km (25 miles) from the East St Louis air pollution monitoring site were excluded.
Outcome and clinical data
Each subject’s ICD was interrogated during regular clinical follow up visits. If a ventricular arrhythmia had been detected by the ICD since the subject’s last clinic visit, and an electrogram was available, the subject was recruited into the study. The electrogram, date, time, and therapy delivered by the device were abstracted for review. Subject information including the patient’s age and current prescribed medications were recorded. Any events occurring during inpatient stays or outpatient procedures were excluded.
For each ICD recorded episode, the electrogram was reviewed and classified by an electrophysiologist (MHK) blinded to air pollution levels. The onset interval, rate, QRS morphology during and prior to the episode, as well as the response to therapy were used to classify the rhythm as a ventricular arrhythmia (i.e. ventricular tachycardia, polymorphic ventricular tachycardia, or ventricular fibrillation), supraventricular arrhythmia (e.g. atrial flutter, atrial fibrillation, atrial tachycardia, etc), sinus tachycardia, noise/over-sensing, or unknown. Only ventricular arrhythmias were included in this analysis. We defined a new ventricular arrhythmia if there was at least 60 minutes since the previous ICD detected arrhythmia. This record review was approved by human study committees at Washington University and the Harvard School of Public Health.
Air pollution
Hourly pollutant concentrations and meteorological conditions were measured at the United States Environmental Protection Agency (USEPA) funded Supersite in East St Louis, Illinois.33 Hourly particulate matter <2.5 µm (PM2.5) was measured using a continuous ambient mass monitor (CAMM; Anderson Instruments, Fultonville, NY). Hourly elemental carbon (EC) and organic carbon (OC) were measured using an ECOC field analyser operated according to the NIOSH Method 5040 thermo-optical protocol (Sunset Laboratories, Inc., Hillsborough, NC). Criteria air pollutants were measured hourly at an adjacent site operated by the Illinois Environmental Protection Agency (IEPA) for the purposes of compliance monitoring. PM2.5 was measured by beta-attenuation (MetOne 120 BAM; MetOne Instruments, Inc., Grants Pass, OR). Nitrogen dioxide was measured by chemiluminescence (API 200A; Acbel Polytech, Inc., Westborough, MA), sulphur dioxide by pulsed fluorescence (Dasibi 4108; Dasibi Environmental Corporation, Las Vegas, NV), carbon monoxide by non-dispersive infrared photometry (TECO48; Thermo Environmental Instruments, Inc., Franklin, MA), and ozone by ultraviolet photometry (Dasibi 1008 RS; Dasibi Environmental Corporation, Las Vegas, NV).
CAMM PM2.5 concentrations that were missing for 1037 hours (7% of 14 448 measurements) were imputed using measurements from the adjacent beta-attenuation PM2.5 monitor. We regressed PM2.5 CAMM concentration against linear and squared beta-attenuation PM2.5 measurements (R2 = 0.6). Missing hourly CAMM PM2.5 concentrations were then imputed by this prediction model. The 21 highest CAMM PM2.5 concentrations (⩾80 µg/m3) were set to missing, as most occurred on 4 July or early 5 July after fireworks displays over the nearby Mississippi River, which drew crowds setting off fireworks immediately adjacent to the monitoring site, and thus were likely not representative of regional fine particle levels. Measured and imputed CAMM PM2.5 concentrations were then used in all analyses.
Analysis
The association of air pollution exposures and ventricular arrhythmias was analysed using a case-crossover design,34 which has previously been used to study triggers of acute cardiovascular events.30,32,35–41 In this design, each subject is defined as a case during the event periods, and a matched control during non-event times. Because each case period and its matching control periods are within the same person and a conditional analysis is conducted, this design controls for non-time varying confounders (e.g. health history, long term smoking history, etc). Variables that may be related to both air pollution and the occurrence of ventricular arrhythmias that vary over time (e.g. season and meteorological conditions) are possible confounders.
Case periods were defined by the time of each confirmed ventricular arrhythmia, rounded to the nearest hour. Control periods were matched on weekday and hour of the day within the same calendar month.42 Hourly pollution concentrations and measurements of temperature, relative humidity, and barometric pressure were then matched to the case and control time periods.
Effect of mean air pollution exposures in the 24 hours before the ventricular arrhythmia
Conditional logistic regression models including natural splines (3 degrees of freedom) for the mean of the previous 24 hours’ temperature, relative humidity, and barometric pressure, and the mean pollutant concentration in the 24 hours before the arrhythmia (mean of lags 0–23) were run separately for each pollutant (PM2.5, elemental carbon, organic carbon, nitrogen dioxide, carbon monoxide, sulphur dioxide, and ozone). Our models assumed independence of events. However, different individuals may have different cardiac responses to pollution, based on their clinical history and genetic characteristics. Therefore, we included a frailty term43 for each subject (akin to a random intercept) in all the above models. Odds ratios and confidence intervals are presented for an interquartile range increase (based on daily means) in each pollutant. Kunzli and Schindler have recently proposed that the reference interval of case-crossover air pollution studies should be the interquartile range of the absolute difference between air pollution concentrations in the matched case and control periods.44 We therefore also report these exposure parameters (case/control IQR).
Sensitivity analysis
We assessed the association of ventricular arrhythmias with moving average pollution concentrations other than the 24 hour moving average. The conditional logistic regression models described above were re-run, replacing the 24 hour moving average with a 6 hour moving average (mean of lag hours 0–5), 12 hour moving average (mean of lag hours 0–11), and 48 hour moving average (mean of lag hours 0–47). We present odds ratios and confidence intervals for the averaging period specific interquartile range increase in SO2, NO2, and elemental carbon, that is the pollutants with associations approaching statistical significance in the 24 hour analyses.
To investigate the sources of air pollution, we generated hourly pollution roses using the hourly average unit vector wind direction measured on-site using a wind vane at 10 metres. The on-site anemometer had a starting threshold of 0.19 m/s. Hours with scalar wind speeds below this threshold (0.7% of all hours) were retained with their respective unit vector wind directions in the generation of the roses. Mean air pollution concentrations were assigned to the 16 cardinal wind directions based on the average wind direction for the hour. Arithmetic mean air pollution concentrations were then calculated and plotted for each cardinal wind direction.
SAS v9.1 (SAS Institute, Inc., Cary, NC) software was used to construct all datasets and calculate descriptive statistics. S-Plus 6.2 (Insightful Inc., Seattle, WA) software was used for all modelling.
RESULTS
There were 60 subjects with at least one ICD recorded arrhythmia who lived within 40 km of the St Louis–Midwest Supersite in East St Louis, IL enrolled in the study. We observed 212 arrhythmic episodes among these 60 patients, of which 151 were separated by more than an hour. After excluding all non-ventricular arrhythmias and events occurring during hospital stays/procedures, there were 139 confirmed ventricular arrhythmias among 56 subjects available for analysis.
At the time of their first confirmed ventricular arrhythmia during follow up, study subjects ranged in age from 20 to 88 years (mean 63). Beta-blockers, digoxin, and other anti-arrhythmics were prescribed for 68%, 43%, and 41% of subjects respectively. Two subjects (4%) were prescribed none of these medications.
Twenty eight subjects (50%) had two or more ventricular arrhythmias during follow up, and three (5%) had seven or more. The frequency of ventricular arrhythmia was lowest at night (12 am to 4 am), and highest in mid morning (8 am to 12 pm) and early evening (4 pm to 8 pm).
Air pollution and weather parameters are summarised in table 1. Daily concentrations of PM2.5 were moderately correlated with NO2 (r = 0.46), CO (r = 0.44), and elemental carbon (r = 0.53), but not with SO2 (r = 0.13) or O3 (r = 0.12). Although NO2 was moderately correlated with CO (r = 0.52) and elemental carbon (r = 0.62), none of these pollutants were correlated with SO2 (NO2 r = 0.25; CO r = 0.17; elemental carbon r = 0.09) or O3 (NO2 r = −0.13; CO r = −0.28; elemental carbon r = −0.09).
Distribution of 24 hour mean air pollution concentrations and meteorology conditions measured at the East St Louis Supersite from May 2001 to December 2002
We found a statistically significant increased risk of ventricular arrhythmias associated with each 5 ppb increase in the 24 hour moving average sulphur dioxide concentration. Although not statistically significant, risk estimates for 24 hour moving average elemental carbon and nitrogen dioxide were also suggestive of increased risk. There did not appear to be increased risk associated with PM2.5, organic carbon, carbon monoxide, or ozone (table 2).
Odds ratio of ventricular arrhythmia (VA) associated with an interquartile range (IQR) increase in the 24 hour (lags 0–23) moving average pollutant concentration; St Louis ICD Study, 2001–02
We found no increased risk associated with the 6 hour (lag 0–5) moving average sulphur dioxide concentration, but did find a statistically significant 17% increase in risk associated with each 5 ppb increase in 12 hour (lag 0–11) moving average sulphur dioxide concentration. A 4 ppb increase in 48 hour (lag 0–47) moving average sulphur dioxide concentration was marginally significantly associated with increased risk. Shorter (6 and 12 hour) and longer (48 hour) moving average risk estimates were lower than the risk estimate for the 24 hour moving average (table 3). We did not find statistically significant increased risk associated with any moving average elemental carbon and/or nitrogen dioxide concentration within 48 hours of the arrhythmia. However, the moving average risk estimates for nitrogen dioxide and elemental carbon were largest for the 24 hour moving average (table 3).
Odds ratio of ventricular arrhythmia associated with an interquartile range increase (IQR) in the 6 (lag 0–5), 12 (lag 0–11), 24 (lag 0–23), and 48 (lag 0–47) hour moving average pollutant concentrations; St Louis ICD Study, 2001–02
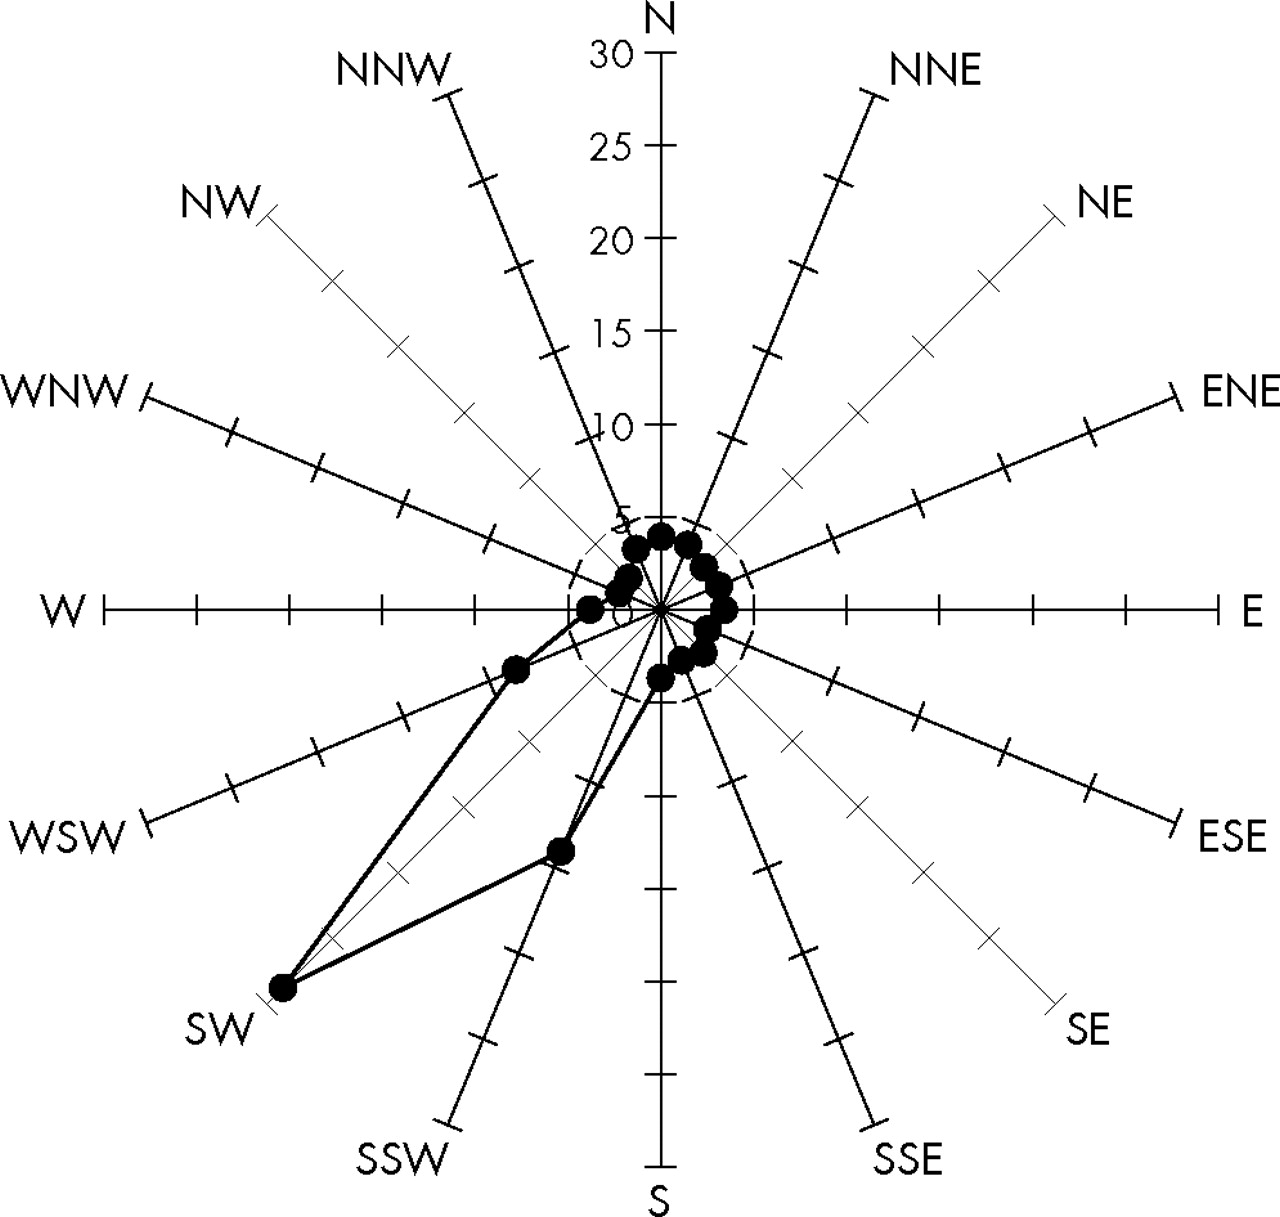
Mean elemental carbon concentrations were ∼2 to 3 times higher when winds were from easterly directions, as compared to concentrations when winds were out of the west (fig 1). Nitrogen dioxide concentrations followed a similar pattern, but the east versus west gradient was not as pronounced (fig 2). Sulphur dioxide concentrations, however, were ∼9 times higher when the winds were out of the southwest (west–southwest to south–southwest) compared to other wind directions (fig 3).

Pollution rose of mean hourly elemental carbon concentrations (µg/m3), by hourly averaged wind directions. St Louis ICD Study, 2001–02.

Pollution rose of mean hourly nitrogen dioxide concentrations (ppb), by hourly averaged wind directions. St Louis ICD Study, 2001–02.
Pollution rose of mean hourly sulphur dioxide concentrations (ppb), by hourly averaged wind directions. St Louis ICD Study, 2001–02.
DISCUSSION
In a population of patients at high risk of ventricular arrhythmias in the St Louis metropolitan area (Missouri/Illinois), we found a statistically significant 24% increase in risk of ventricular arrhythmias associated with each 5 ppb increase in mean sulphur dioxide concentration within 24 hours of the arrhythmia. We found suggestions of increased risk associated with elemental carbon concentration and nitrogen dioxide concentration during the same time period. We found the largest risks associated with the 24 hour moving averages of sulphur dioxide, nitrogen dioxide, and elemental carbon, and no evidence of stronger associations with shorter averaging times. We saw no evidence of later effects, as the risk estimates for the 48 hour moving averages were consistently lower than the 24 hour moving averages. Thus, the relevant exposures were best captured using the 24 hour moving average concentration prior to the arrhythmia. In Boston, we have previously shown stronger associations with 24 hour moving average concentrations than with calendar day mean concentrations.30
The results of the present study are similar to those seen previously in a study of ICD detected ventricular arrhythmias in Boston28–30 with respect to the time course from exposure to the observed effect on arrhythmia risk. However, there are also important differences. In Boston, when we examined exposures less than 24 hours before the arrhythmia, we also found no evidence for immediate effects of any pollutant.30 We did find statistically significant increases in risk of ventricular arrhythmia associated with mean PM2.5 and ozone in the 24 hours before the arrhythmia, but found no significant association with sulphur dioxide.30 In the present study, we did not observe any increase in risk associated with PM2.5, and the observed association with ozone, while positive, was weak and not statistically significant. In contrast, Vedal et al and Rich et al found no consistently increased risk of ICD shock associated with daily ambient air pollution in Vancouver, Canada.31,32 The reason for these differences is unclear, but may reflect differences in the mix of and sources of air pollution in St Louis, Boston, and Vancouver.
The pollution roses for nitrogen dioxide and elemental carbon (traditionally thought of as markers of motor vehicle pollution) were suggestive of sources to the east–southeast of the monitoring station. The sulphur dioxide pollution rose, however, is markedly different. It implicates a source(s) located to the southwest of the monitoring station. Kim et al and Lee and Hopke have performed source apportionment analyses in the St Louis metropolitan area, and have examined the spatial variability of these source specific particles in great detail.45–47 However, before attributing risk to any specific source or source category, examination of the association between ICD detected ventricular arrhythmias and acute increases in these source specific particle concentrations is needed. Sulphur dioxide may be the specific toxic agent, or it may be a marker for other pollutants that may be responsible for the associations with ventricular arrhythmias observed here. Furthermore, more information is needed concerning the spatial representativeness of the measured air quality parameters.
This study was limited by small sample size and non-differential misclassification of exposure (i.e. concentrations at central monitor used as proxies for personal exposures), resulting in reduced statistical power. We had little power to detect small to moderate increases in risk, and less power to explore effect modification by patient or event characteristics as in our Boston study.28–30 Since we found statistically significant increased risk only with sulphur dioxide in two models, and not with any other pollutants considered, it is possible that these results are spurious. However, the risk pattern (no evidence of an immediate effect, largest risk estimates with the 24 hour moving average compared to shorter and longer moving averages) is consistent with that seen in Boston, suggesting a real association.
Clinic staff prospectively collected all ventricular arrhythmias occurring in patients seen at the clinic. Other obligations to the clinic and/or patient care demands may have resulted in some of these arrhythmias being missed. Further, the clinic staff selected only those ICD recorded episodes with available electrograms and only those which they diagnosed as ventricular in origin. We therefore expect that there was incomplete outcome ascertainment of ventricular arrhythmias. However, since we used case-crossover methods where each person is their own control and event times are contrasted with matched control times, these deficiencies would only have resulted in a loss of power, but not a bias in our risk estimates.
Main messages
-
There was a statistically significant (24%, 95% CI 7% to 44%) increase in risk of ventricular arrhythmias associated with each 5 ppb increase in mean sulphur dioxide concentration in the 24 hours before the arrhythmia.
-
There were non-significantly increased risks (22%, 95% CI −6% to 60%; and 18%, 95% CI −7% to 50%) associated with increases in nitrogen dioxide (6 ppb) and elemental carbon (0.5 and μg/m3) concentration in the 24 hours before the arrhythmia, respectively.
-
There was no evidence of associations with shorter moving averages (i.e. mean pollutant concentrations in the 6 hours or 12 hours before the arrhythmia).
-
These results provide evidence of an acute association between ventricular arrhythmias and ambient air pollutants in the St Louis metropolitan area.
Policy implications
-
This study is consistent with previous studies in Boston, suggesting that those subjects with pre-existing cardiovascular disease may be susceptible to the effects of ambient air pollution, although the pollutants responsible for the increased risk are different.
We found ambient air pollution was associated with increased risk of ventricular arrhythmias in patients implanted with ICDs, suggesting there is an acute cardiac response to increases in ambient air pollution. We identified 24 hour moving average sulphur dioxide, nitrogen dioxide, and elemental carbon as pollutant/averaging times of interest. Further, associations have now been seen in two of three cities (Boston, St Louis) with different pollution mixes, although the pollutants responsible for that increased risk are different. Use of more detailed pollutant measurements and particle characterisations from the USEPA funded St Louis–Midwest Supersite in East St Louis, Illinois may provide more insight into these associations.
Acknowledgments
We would like to thank Judy Osborn and Dr Jane Chen for their assistance in study design and outcome collection, Dr Heike Luttmann-Gibson for quality assurance review, Azadeh Tehranian, Jim Sullivan, and Mark Davey for their organisation and quality assurance review of the air pollution data, and the study subjects for their participation. This paper is solely the responsibility of the authors. Although the research described in this paper has been funded wholly or in part by NIEHS, NIH, EPRI, and EPA it has not been subjected to the respective peer and policy review requirements of these organisations and therefore does not necessarily reflect their views, and no official endorsement should be inferred.
REFERENCES
Footnotes
-
Published Online First 12 May 2006
-
Funding: This study was funded in part by a National Institute of Environmental Health Sciences program project grant (NIEHS ES-09825) and the Harvard National Institute of Environmental Health Sciences Center for Environmental Health (NIEHS ES00002). Air pollution measurements were funded in part by the EPA St Louis–Midwest Supersite (USEPA Cooperative Agreement R-82805901-0 and Grant X-98722301-0), EPA/Harvard Center on Ambient Particle Health Effects (USEPA Grant R827353), and the Electric Power Research Institute (EPRI Grant W09207-02). Dr David Rich received support from NIEHS Grant # T32 E207069.
-
Competing interests: MHK has been a consultant/speaker for Medtronic and has had research funding with Medtronic, Guidant, and St Jude Medical. JRT has received research funding from the Electric Power Research Institute (EPRI).