Article Text

Abstract
Objectives: The authors examined the increase in mortality associated with hot and cold temperature in different locations, the determinants of the variability in effect estimates, and its implications for adaptation.
Methods: The authors conducted a case-crossover study in 50 US cities. They used daily mortality and weather data for 6 513 330 deaths occurring during 1989–2000. Exposure was assessed using two approaches. First, the authors determined exposure to extreme temperatures using city-specific indicator variables based on the local temperature distribution. Secondly, they used piecewise linear variables to assess exposure to temperature on a continuous scale above/below a threshold. Effects of hot and cold temperature were examined in season-specific models. In a meta-analysis of the city-specific results, the authors examined several city characteristics as effect modifiers.
Results: Mortality increases associated with both extreme cold (2-day cumulative increase 1.59% (95% CI 0.56 to 2.63)) and extreme heat (5.74% (95% CI 3.38 to 8.15)) were found, the former being especially marked for myocardial infarction and cardiac arrest deaths. The increase in mortality was less marked at less extreme temperatures. The effect of extreme cold (defined as a percentile) was homogeneous across cities with different climates, suggesting that only the unusualness of the cold temperature (and not its absolute value) had a substantial impact on mortality (that is, acclimatisation to cold). Conversely, heat effects were quite heterogeneous, with the largest effects observed in cities with milder summers, less air conditioning and higher population density. Adjustment for ozone led to similar results, but some residual confounding could be present due to other uncontrolled pollutants.
Conclusions: The authors confirmed in a large sample of cities that both cold and hot temperatures increase mortality risk. These findings suggest that increases in heat-related mortality due to global warming are unlikely to be compensated for by decreases in cold-related mortality and that population acclimatisation to heat is still incomplete.
Statistics from Altmetric.com
Determining the potential health impacts of climate change is a complex issue. Both direct physical impacts from weather changes (for example, temperature increase, severe storms) and indirect impacts from changes in other factors (for example, vector-borne diseases, food production, population dislocation, etc) are expected to occur and should be taken into account when assessing the global impact of climate change.1 This paper focuses exclusively on the direct health effects of changes in temperature, and particularly on the impact on mortality. Climate change is predicted not only to increase the average temperature of the planet by between 1.7 and 4.9°C by 2100,2 3 but also to change the frequency of extreme weather events increasing extremely hot days and decreasing extremely cold days.1 Because variations in morbidity and mortality rates have been associated with temperature changes,4–7 controversy exists regarding what the overall effect of climate change will be. Some authors have suggested that increases in heat-related mortality will be so dramatic that they will not be compensated for by drops in cold-related mortality,8 while others believe that human populations will adjust to warmer temperatures and any small increases in heat-related mortality will be outweighed by larger declines in cold-related mortality.9
Increases in mortality during the cold months have been widely reported in the literature, often referred to as excess winter mortality, and an important proportion of these deaths have been attributed to cardiovascular diseases.7 Similarly, the effect of elevated temperatures on mortality, especially those occurring during heat waves, have also been described in several studies where cardiovascular and respiratory diseases were reported as the most common mortality causes.4 6 Fewer studies have looked at the association between more specific cardiovascular causes of death and temperature. A recent study in 12 US cities showed moderate increases in myocardial infarction deaths associated with both cold and hot temperatures.10 Consistently, in a previous study looking at susceptibility to temperature extremes in 50 US cities, we identified myocardial infarction and cardiac arrest as the primary causes of death that experienced the largest relative increases during extremely cold days.11
Estimates of the magnitude of the temperature effect on mortality have differed substantially across different regions, but few studies have investigated which factors account for this variability. In the Eurowinter study, the cold effects were milder in cities with cooler winters, where protective measures against cold were more effective.12 A study in the US found that cities with a greater variability in temperature showed stronger temperature effects, while use of air conditioning reduced the heat mortality.5 Another US study found differing shapes of the mortality–temperature relation for northern and southern cities, and reported as modifiers of the heat effect use of air conditioning and some demographic characteristics of the population.13
Recognising the determinants of regional variability in the impact of temperature on mortality and understanding the role of adaptive mechanisms in modifying that impact is key to better ascertain the potential public health consequences of global warming. We therefore conducted a large multicity study in 50 US cities to evaluate the effect of cold and hot temperatures on both all-cause and cause-specific mortality and to determine how several city characteristics may influence the impact of temperature on mortality.
METHODS
Study design and population
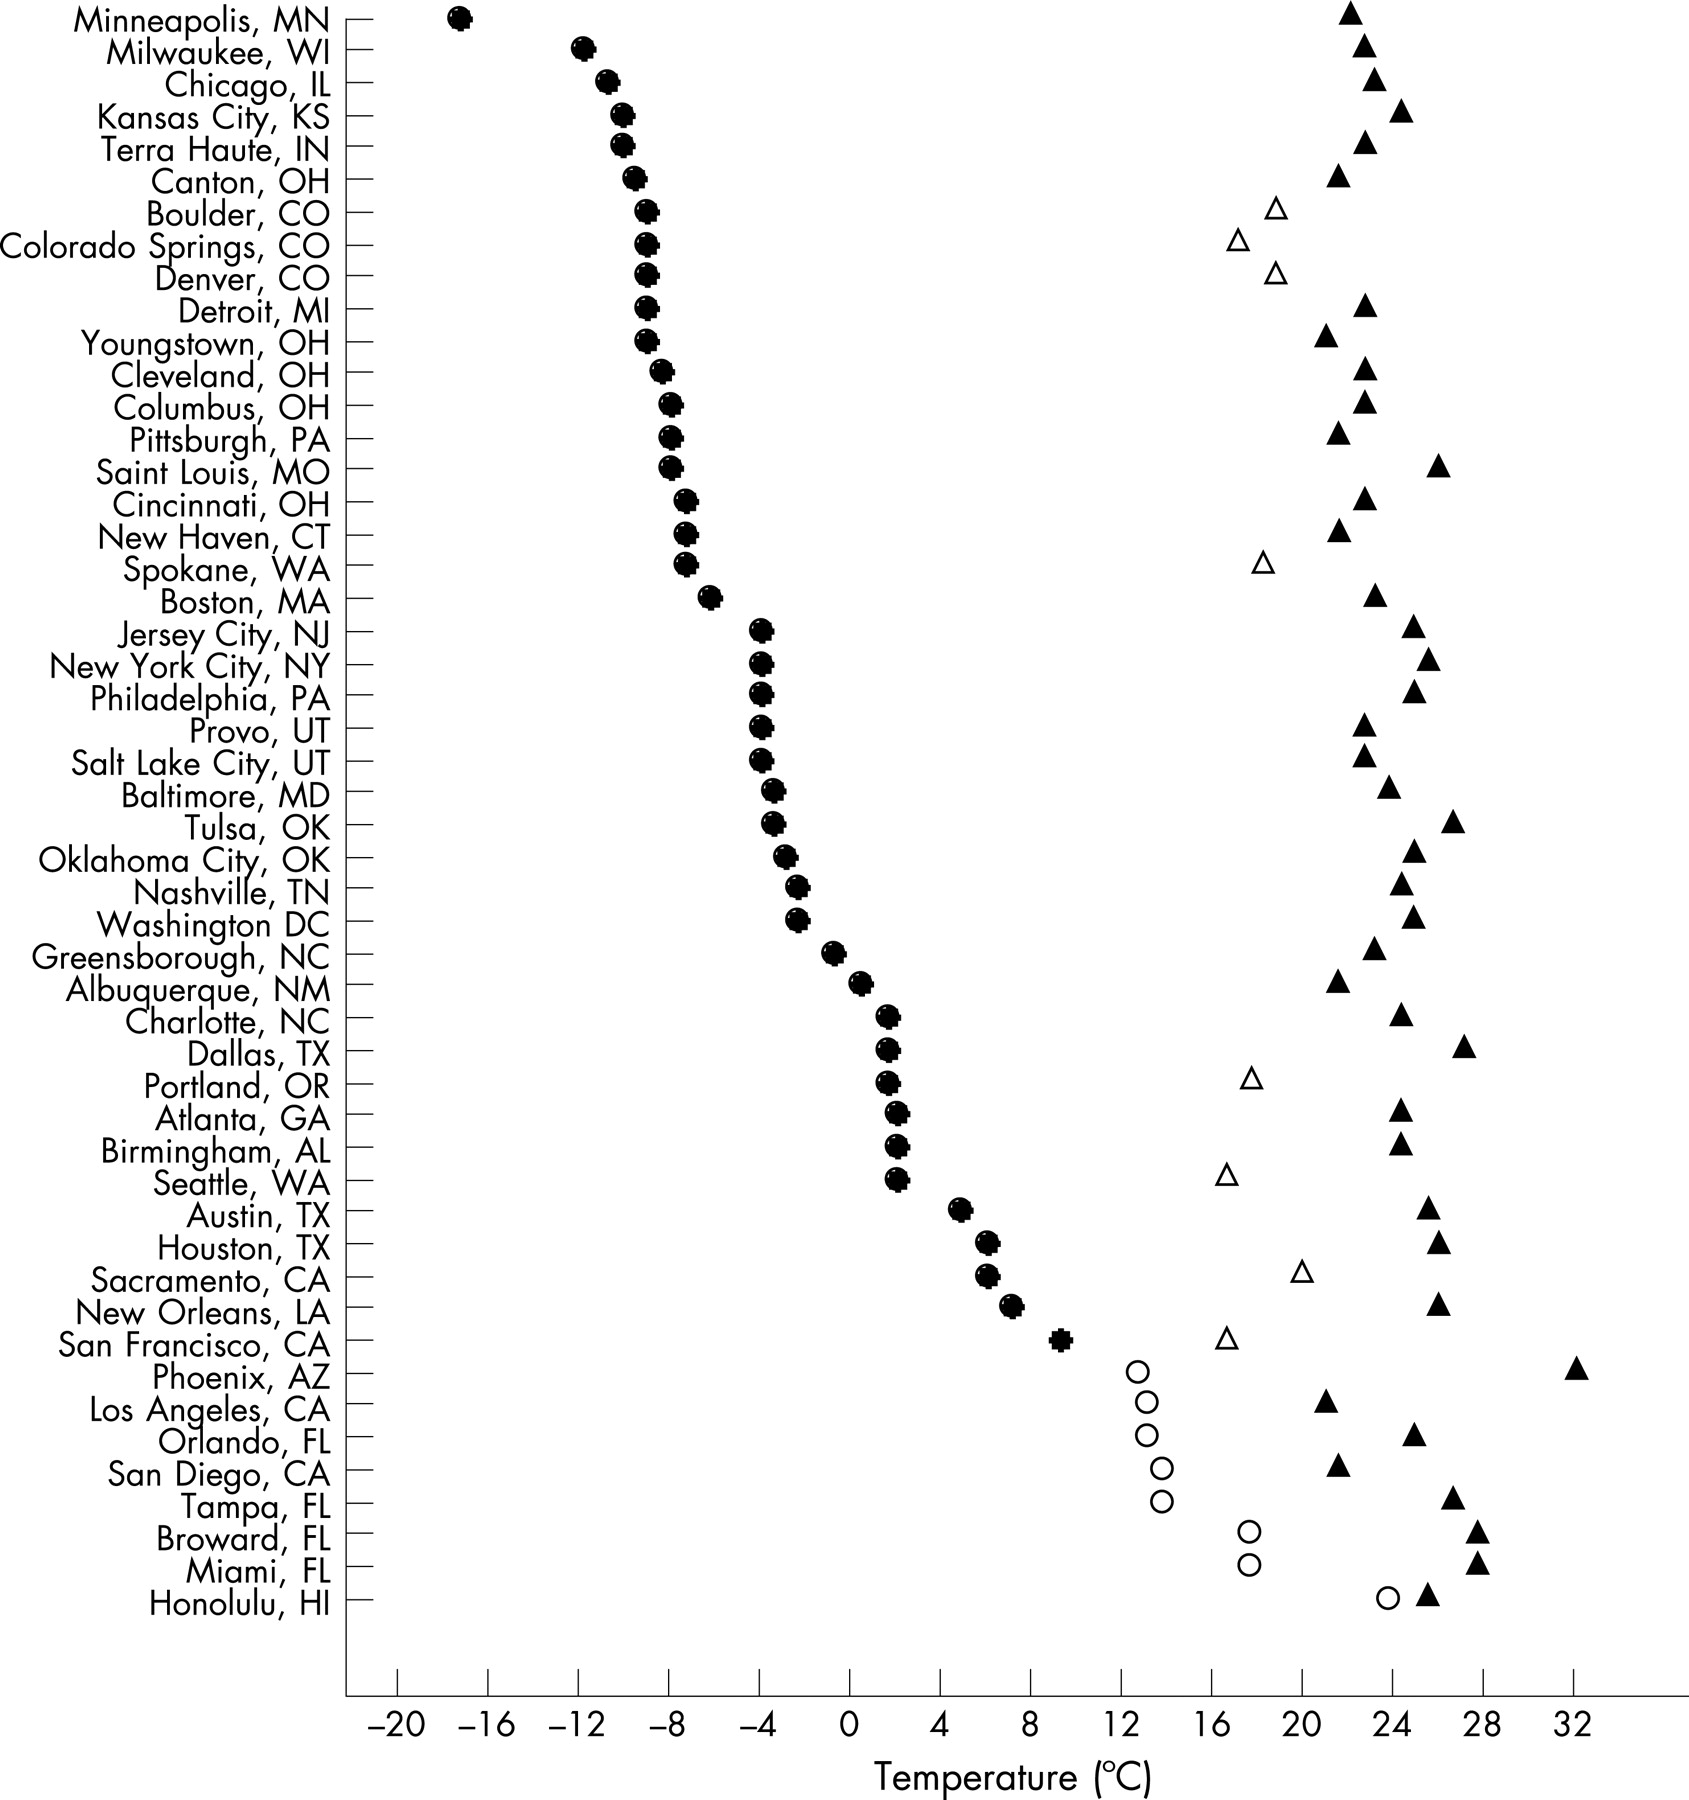
We conducted a case-crossover analysis in 50 US cities during the period 1989–2000. We used daily mortality data from all counties in the Metropolitan Statistical Area of cities presented in figure 1. Cities were randomly chosen from the country’s most populated Metropolitan Statistical Areas with urban counties near appropriate weather stations. A few less-populated cities were also included from census regions that would otherwise have been unrepresented.

The case-crossover design is commonly used in air pollution studies. It is a variation of the matched case-control design in which each case subject (a decedent in this instance) serves as his own control on days when no event (death) occurs.14 In other words, each stratum consists of one case day and multiple control days such that the subject’s exposure at the time of the event is compared with his exposure on the reference days. An advantage of this design is that, if control days are chosen close in time to the event day, there is no confounding by slowly varying personal characteristics (because each subject is the perfect match for himself) and even very strong seasonal confounding of exposure can be removed.15 16
Mortality data
For each city, we obtained daily mortality data from the National Center for Health Statistics, which included individual information on primary and secondary causes of death and other personal characteristics. We examined all-cause mortality as well as two specific primary causes of death that we had previously identified as particularly sensitive to extreme cold:11 myocardial infarction (International Classification of Diseases-9th revision (ICD-9) code: 410; ICD-10: I21, I22) and cardiac arrest (ICD-9: 427.5; ICD-10: I46).
Exposure assessment
For each city, we obtained hourly weather data from the nearest National Weather Service Surface Station (Earthinfo Inc, Boulder, CO, USA) and calculated the daily maximum and minimum temperatures to examine exposure to cold and heat, respectively. We made that choice to capture situations in which cold temperatures are sustained during the day and hot temperatures do not cool at night.
We used two different approaches to assess exposure to temperature. First, we determined exposure to extreme cold and extreme heat using city-specific indicator variables based on the distribution of temperatures in each city. Specifically, we defined extremely cold days as those with a daily maximum temperature ⩽1st percentile and extremely hot days as those with a daily minimum temperature ⩾99th percentile. Using this definition, the cutoff points defined as extreme temperatures in some cities were in fact quite mild. For that reason, those cities with a cutoff for extreme cold ⩾10°C or a cutoff for extreme heat ⩽20°C were excluded from the cold and heat analysis, respectively, leaving a total of 42 cities for each analysis.
In the second approach, we used two piecewise linear exposure variables to describe exposure to temperature on a continuous scale but reflecting the fact that U- or J-shaped relations have been reported.4 13 The exposure variable for cold took a constant value of zero when the daily maximum temperature was ⩾17°C and then increased with increasing cold. Likewise, the exposure variable for heat took value zero when the daily minimum temperature was ⩽17°C and increased with increasing hot temperature. We chose these two knots to ensure at least 10% of the days took a value different from zero in all cities. It is worth noting that in our sample the average range between the maximum and the minimum daily temperature was 10°C, allowing for some variation across cities in the temperature at which the inflection in the U-shaped curve occurs, as described by Curriero et al.13 For comparability reasons, cities excluded from the extreme temperatures analysis were also excluded in this second approach.
We obtained daily concentrations of ozone (8-h mean) from the US Environmental Protection Agency’s Aerometric Information Retrieval System. We assigned daily ozone levels to all cities included in the heat analyses (except Minneapolis, where it was missing) using an algorithm that averaged levels reported by multiple monitoring locations.17
City characteristics
Based on previous studies, we examined several city characteristics as potential determinants of the impact of temperature on mortality. As a proxy for the local climatology, we examined the mean and variance of the daily mean temperature during the cold (November through March) and warm (May through September) months. We also examined the population density, calculated using data from the 2000 US Census, as an indicator of urbanisation. Finally, we examined the percentage of households in each city with central heating and central air conditioning, two major technological adaptive mechanisms for which data were available from the American Housing Survey of the US Census Bureau (1994–2002).18
Statistical analyses
We conducted separate analyses for the cold (November through March) and warm (May through September) months to examine the association between temperature (either extreme or piecewise linear) and both all-cause and cause-specific mortality. None of the cold months included “extremely hot days” and vice versa.
In a first stage, we fitted city-specific conditional logistic regression models (PROC PHREG in SAS, SAS software release 8.2 2001, SAS Institute, Cary, NC, USA). To avoid seasonal confounding, we applied a time-stratified approach by choosing control days only within the same month of the same year that death occurred.19 We used every third day of that month as control days to reduce serial correlation in the exposure variable, given that in the US weather fronts generally pass through a city every 3–4 days. All models controlled for day of the week using indicator variables. Temperature was included as a binary variable (for extreme temperature) or as a piecewise linear variable (for continuous temperature). We estimated the effect of temperature on the same day (lag 0) and on the day before (lag 1) by including both lags in the model simultaneously. Then, we calculated the 2-day cumulative risk estimate by summing the estimates for lag 0 and lag 1. To assess potential confounding by ozone air pollution, we repeated the models that examined the heat effect on total mortality adjusting for ozone exposure at lag 0 and 1.
In a second stage of the analyses, we combined the city-specific estimates in a random-effects meta-analysis using the restricted maximum likelihood method in the metareg procedure in Stata (version 8, Stata Corporation, College Station, TX, USA).20 This procedure calculates the overall effect estimate by fitting a weighted regression model with weights wi = 1/(vi+τ2), where νi is the variance within city i and τ2 is the between-cities variance. First we fitted meta-analyses without covariates, then for models estimating the overall two-day cumulative effect we included each city characteristic as a covariate to test whether heterogeneity in city-specific estimates could be explained by that characteristic. Based on results from the last models, we predicted the effect of temperature on mortality at the 25th and the 75th percentile of the distribution of each city characteristic. Note that because the overall two-day cumulative estimates were based on the meta-analysis of the city-specific cumulative estimates, their value was not necessarily the same as the sum of the overall estimates for lag 0 and lag 1, which ignores covariance between the two estimates.
RESULTS
Our analyses included a total of 6 513 330 deaths across 50 US cities. Myocardial infarction and cardiac arrest were the primary cause of 8.4% and 0.8% of all deaths, respectively. Table 1 shows the distribution of mortality counts and city characteristics across all cities. The average temperature ranged from −4.1°C to 14.5°C during the cold months across those cities included in the cold analyses, and from 18.5°C to 32.1°C during the warm months for cities in the heat analyses. Air conditioning was more common in cities with a low variability and a high mean of temperature during the warm months (Spearman’s r = −0.45 and 0.81, respectively), two city characteristics that, in turn, were inversely correlated with each other (r = −0.63). Cities with a lower mean temperature during the cold months had a larger percentage of heating (r = −0.64) and a larger temperature variability during the cold season (r = −0.52).
The cutoff points used to define extreme temperatures in each city are shown in figure 1. Phoenix (AZ) had the highest temperature cutoff for extreme heat with 32.2°C, and Minneapolis (MN) had the lowest for extreme cold with −17.2°C.
Table 2 shows the per cent change in mortality associated with cold and hot temperatures across all cities. Extremely cold days were associated with significant increases in total mortality (two-day cumulative increase 1.59% (95% CI 0.56 to 2.63)), and this was particularly noticeable for myocardial infarction (3.90% (95% CI 0.18 to 7.76)) and cardiac arrest (16.2% (95% CI 5.12 to 28.4)) deaths. Extremely hot days were also associated with large increases in total mortality, with a two-day cumulative increase of 5.74% (95% CI 3.38 to 8.15). When assessing the effect of piecewise linear temperature, the increase in mortality was less marked than for extreme temperatures and, in the case of heat, the initial increase in all-cause mortality at lag 0 was followed by a slight mortality decrease at lag 1. Adjustment for ozone reduced the effect of extreme heat and linear hot temperature on total mortality by 15% and 16%, respectively.
The effect of cold temperatures was quite homogeneous across cities for both extreme temperatures and piecewise linear temperature. The proportion of total variation in all-cause mortality estimates (two-day cumulative) that was due to between-cities heterogeneity was 2.6% for extreme cold and 26% for piecewise linear cold temperature, as ascertained by the I2 statistic.21 Conversely, the heat effect was very heterogeneous across cities. In this instance, the proportion of total variation in all-cause mortality estimates attributable to between-cities differences was 86% for extreme heat and 82% for piecewise linear hot temperature.
When examining effect modification by city characteristics, we did not find any evidence of significant modification of the cold effect (table 3), whereas some of the heterogeneity observed for the heat estimates was explained by several city characteristics (table 4). Overall, the largest increases in mortality due to extreme heat were observed in those cities with milder warm seasons. For instance, in a city with a mean temperature of 19.8°C during the warm months (that is, in the 25th percentile of the distribution) all-cause mortality increased 9.25% on extremely hot days, while in a city in the 75th percentile (that is, 24.8°C) the increase was only 3.81%. Similarly, the effects of extreme heat were consistently lower in cities with a low variability in warm months’ temperature, in those with a large proportion of central air conditioning and in those with a low population density. When looking at modifiers of the effect of linear hot temperature (above 17°C), results were very similar to those presented in table 4. After adjusting the total mortality estimates for ozone, effect modification remained essentially the same for both extreme and less extreme heat.
DISCUSSION
In a large case-crossover study we found an effect of both cold and hot temperatures on mortality, the former being especially marked for myocardial infarction and cardiac arrest mortality. Overall, the effect of temperature became more evident when temperature was at the very end of its distribution as opposed to less extreme cold and hot temperatures (treated linearly as absolute temperature above/below a threshold). In this last instance, we observed some evidence that the deaths occurring on warm days were partially counterbalanced by reduced deaths the next day. We also found evidence of a successful acclimatisation to cold in all regions, with homogeneous effects across cities when cold was defined as a percentile of local temperatures. The heat effects, in contrast, showed heterogeneity, which was explained in part by mean and variance of temperature during the warm months, air conditioning and population density.
Our study showed important increases in daily mortality with cold temperatures, particularly for myocardial infarction and cardiac arrest mortality. Consistently, a study in 12 US cities found moderate increases in myocardial infarction mortality associated with cold temperatures10 and the Eurowinter study in Europe found increases in all-cause and ischaemic heart disease mortality per 1°C fall in temperature that were comparable to our estimates for the piecewise linear effect.12 However, our estimates of mortality on extremely cold days were higher than would be predicted by our models of mortality increase per 1°C fall in temperature, suggesting that treating temperature continuously may understate the effect of rare extreme conditions. This is also consistent with our finding that the effect of extreme cold was homogeneous across a 26°C-wide range of local definition of extreme cold. This suggests that unexpectedly cold days have effects that are poorly captured by looking at absolute temperature. Also of special interest was the large increase in cardiac arrest deaths we observed on extremely cold days, which reached 16% when two days in a row were extremely cold. In a previous case-only analysis a high susceptibility of cardiac arrest deaths to cold temperature was reported, but the absolute increase in mortality could not be estimated.11 To our knowledge, no other epidemiological study has reported increases in cardiac arrest mortality associated with outdoor cold temperatures. There is some evidence, though, for large increases in emergency department presentation of cardiac arrest on snowfall days.22
The underlying mechanisms related to the increase in cardiac deaths with cold temperatures have been postulated. An increase in plasma cholesterol and plasma fibrinogen with cold temperatures,23–25 coupled with a higher blood pressure in winter,26 27 could lead to thrombosis through haemoconcentration and trigger an acute cardiac event. Moreover, the inclement weather that is often associated with cold days may also contribute to cardiac mortality by reducing access to a hospital or by increasing physical activity in the cold (for example, shovelling snow).28 Overexertion in a cold environment may trigger surges in blood pressure that could lead to coronary plaque rupture and subsequent coronary thrombosis.29
We found large increases in all-cause and myocardial infarction mortality associated with hot temperatures, which is consistent with previous studies.4 6 Of particular interest was the difference we observed in the heat effect when temperatures were extreme as compared with less extreme values. In the last situation, there appeared to be a harvesting effect—that is, an initial increase in mortality followed by a period of lower-than-average mortality. This pattern has been observed by other studies on heat mortality8 10 and it is often interpreted as a displacement of deaths that would have occurred in subsequent days regardless of the weather.9 The absence of such a pattern for extreme temperatures suggests a stronger and more stable effect than for less extreme values. However, our study was not designed to appropriately assess the presence of harvesting by examining longer lags, and thus we cannot rule out the occurrence of a harvesting effect for extreme temperatures beyond lag 1. Consistent with our results, a recent study during the 2003 heat wave in France reported that, at such exceptionally high temperatures, less than 10% of the excess mortality corresponded to harvesting.30 The underlying mechanisms for the observed increase in mortality may be related to the stress placed on the respiratory and circulatory systems to increase heat loss through skin surface blood circulation.4 31 This coupled with an increase in blood viscosity and cholesterol levels32 may increase the risk for cardio-respiratory deaths.
Our results support the existence of population acclimatisation, understood as the adaptation of humans to their local weather conditions. If acclimatisation is complete, one might expect that only temperatures out of the ordinary would produce a substantial effect on mortality and, thus, similar effects should be observed in all cities for temperatures at a given percentile. Our findings for extreme cold are consistent with this pattern, as we saw no heterogeneity across cities where the 1st percentile of maximum daily temperature varied from 9°C to −17°C. Central heating, which constitutes an important adaptive mechanism against cold, is almost universal in the US and this may explain why the US population seemed fully acclimatised to cold. Thus, little reduction in wintertime mortality should be expected in the US as a result of global warming.
In contrast, we did not find similar effects of minimum daily temperatures exceeding the 99th percentile across cities, indicating that something more than the unusualness of the temperature was affecting the mortality response. We found that heat effects were greater in cities with lower and more variable temperatures during the warm months, which is consistent with results from Braga et al.5 Cities with a high variance in their warm months’ temperature have, perforce, a greater absolute difference between the 99th percentile and the mean temperature, as well as more sudden changes in temperature. Our results suggest that, at least for extreme heat, these differences matter. Moreover, the prevalence of air conditioning, which reduced the heat effects in our study and in others,5 13 was also lower in these cities. This indicates that adaptation to heat may not be complete in those locations where summer temperatures are not consistently high and may explain why extreme heat behaves differently than extreme cold.
We also found a greater effect of hot temperatures on more densely populated locations. Urban living may involve not only a different lifestyle but also a greater exposure to heat, especially for those residing on the top floor of apartment buildings.33 34 Temperatures are usually higher and heat is more efficiently retained throughout the night-time in the urban core than in the surrounding areas (the so-called “urban heat island effect”).6 35 Thus, for a given temperature averaged throughout a region, urban inhabitants will likely be more exposed to heat and suffer worse consequences than those in the outlying suburban and rural areas.36 Because we used airport weather stations for temperature measures, this disparity between the actual urban temperature and the one used in our analysis will likely occur for a larger proportion of the population in more densely populated locations.
It is controversial whether decreases in cold-related mortality as a result of global warming will compensate for increases in heat-related mortality.8 9 Although mortality rates peak during the winter, a considerable proportion of winter excess deaths have been attributed to respiratory infections,7 which are not directly related to ambient temperature. In our study, the effects of extreme heat on all-cause mortality were much stronger than the cold effects, and the effects of extreme cold appeared driven only by the percentile, and not the absolute temperature, suggesting adaptation. Although the overall effect of climate change on mortality will ultimately depend on the temperature changes that take place, our study supports the hypothesis that decreases in cold-related mortality will likely not offset the dramatic increases in heat-related mortality. This may still be true even if a harvesting for heat effects occurs, given previous suggestions that the proportion of deaths representing short-term mortality displacement during heat waves is approximately 10% to 40%.30 37
Our findings strongly suggest that any assessment of the public health impact of global warming should take into account the ability of populations to adapt. Central heating prevalence may be a key to cold adaptation. Heat effects show more regional variation in the US, and likely elsewhere in the world. Given that significant increases in heat-related mortality were observed even in the hottest cities, where adaptive mechanisms are common, heat effects may not be fully compensated for. Moreover, it is important to bear in mind that technological adaptations, such as air conditioning, may not be easily accessible to socially disadvantaged groups38 or to populations living in developing countries. Making air conditioning universally available may reduce heat-related mortality but would, on the other hand, have a perverse effect by enhancing global warming through carbon dioxide emissions from electricity consumption.
Main messages
Changes in the frequency of temperature extremes as a result of climate change will likely result in changes in temperature-related mortality.
Our results support the hypothesis that the expected increases in heat-related mortality as a result of global warming will not be compensated for by decreases in cold-related mortality in the US.
Despite a wide range of temperatures, the US population seems fully acclimatised to cold temperatures, but not to heat. This may reflect the near universality of central heating in the US, as opposed to central air conditioning, which explained a substantial fraction of the heterogeneity between cities in the heat effects.
Even though the heat effects in the hottest cities were much lower, increases in heat-related mortality in those cities were still large and significant.
Policy implications
Any assessment of the public health consequences of global warming should take into account the ability of populations to adapt to the new temperatures. Central heating and air conditioning are important elements of that adaptation, but in themselves contribute to greenhouse gas emissions. Improved efficiency needs to be emphasised along with the spread of these technologies, to mitigate the effects of temperature.
The variance of summer temperature is an important predictor of the effect of very hot days, and more attention needs to be paid to the possibility that this variance will change as the climate changes.
One of the limitations of our study is the failure to control for the effects of particulate matter air pollution due to the limited number of measurements available for the study period. Even though adjustment for ozone in our study reduced the heat effect on total mortality by 15–16%, associations remained significant. Recently, O’Neill et al examined the impact of control for both ozone and particulate matter and found that the effect of high temperature on mortality was reduced by about 30% but associations persisted.39 Another limitation of our study is the use of ambient temperature as a surrogate for personal exposure. The misclassification derived from this assumption will be largely determined by the extent to which ambient and microenvironmental temperatures are correlated,4 which will likely be affected by adaptive mechanisms such as use of air conditioning. In our analyses we partially controlled for the latter, but misclassification of individual exposure remains inherent to the use of an ecological measure of exposure. Increased adaptation may also change the misclassification over time. Finally, because with climate change temperatures in the hottest cities will likely exceed the range here studied, the effects on mortality at those extremely high values remain uncertain.
In conclusion, our study confirmed in a large sample of cities that both cold and hot temperatures increase the risk of dying, especially at extreme temperature values. Although myocardial infarction and cardiac arrest mortality increase considerably on cold days, increases in all-cause mortality appear to be more pronounced on extremely hot days. Our findings suggest that decreases in cold weather as a result of global warming are unlikely to result in decreases in cold-related mortality in the US. Heat-related mortality, in contrast, may increase, particularly if global warming is associated with increased variance of summer temperature.
Acknowledgments
The authors would like to thank David P Cavanagh for his assistance in data management and Andrea Baccarelli for his helpful comments.
REFERENCES
Footnotes
Funding: This study was funded by EPA Grant R832416-010 and NIEHS grant ES-0002. None of the funding institutions was involved in the study design, collection, analysis or interpretation of data, or in the writing of the report or submission for publication.
Competing interests: None.
- Abbreviations:
- ICD-9
- International Classification of Diseases-9th revision
- ICD-10
- International Classification of Diseases-10th revision