Article Text

Abstract
Objectives The aim of the study is to compare trends in the incidence of injury resulting from workplace violence for men and women at the population level over the period 2002–2015 among working-age adults in Ontario, Canada.
Methods Administrative records of injury resulting from workplace violence were obtained from two population-based data sources in Ontario: 21 228 lost-time workers’ compensation claims (2002–2015) and 13 245 records of non-scheduled emergency department visits (2004–2014), where the main problem was attributed to a workplace violence event. Denominator counts were estimated from labour force surveys conducted by Statistics Canada, stratified by age and sex. Age-standardised rates were calculated using the direct method.
Results Over the observation period, workplace violence incidence rates were in the range of 0.2–0.5 per 1000 full-time equivalent workers. Incidence rates of injury due to workplace violence among women increased over the observation period, with an average annual per cent change (APC) of 2.8% (95% CI 1.7% to 3.9%) in compensation claims and 2.7% (95% CI 1.0% to 4.4%) in emergency department visits. In contrast, there was no change in workplace violence injury rates among men in compensation claims (APC: −0.2% (95% CI −1.2% to 0.9%)) or in emergency department visits (APC: −0.5% (95% CI −1.6% to 0.6%)). A pronounced increase in workplace violence injury rates was observed in the education sector with an APC=7.0% (95% CI 5.6% to 8.5%) for women and an APC=4.1% (95% CI 0.9% to 7.4%) for men.
Conclusions Differences in the risk of injury resulting from workplace violence for women relative to men in Ontario between 2002 and 2015 were verified by two data sources. The relative risk of violence for men and women also differed across industries.
- workplace violence
- injury
- gender
This is an open access article distributed in accordance with the Creative Commons Attribution Non Commercial (CC BY-NC 4.0) license, which permits others to distribute, remix, adapt, build upon this work non-commercially, and license their derivative works on different terms, provided the original work is properly cited, appropriate credit is given, any changes made indicated, and the use is non-commercial. See: http://creativecommons.org/licenses/by-nc/4.0/.
Statistics from Altmetric.com
Key messages
What is already known about this subject?
Despite the introduction of regulatory requirements to control the risks of workplace violence, the number of injuries attributed to workplace violence has not declined in Canada.
There has been lack of studies on factors associated with workplace violence in Canada.
What are the new findings?
This study demonstrates that male/female differences in workplace violence are increasing in Ontario, driven by an increase in rates of workplace violence among women.
The relative risk of injuries attributed to workplace violence for men and women differed across industries, with much of the increase in the risk of injury due to workplace violence for women arising in the education sector.
How might this impact on policy or clinical practice in the foreseeable future?
The evidence from this study highlights the potential for routine injury surveillance to improve understanding of the risk of workplace violence over time.
More active examination of changes in risk for workplace violence within specific labour force subgroups is also warranted.
Introduction
Violence is an important public health concern in many countries, with increasing attention focused on injury arising from workplace violence.1–3 For example, data from Statistics Canada’s 2004 General Social Survey (GSS) suggests that nearly one in five violent incidents in Canada occurs in the victim’s workplace.4 Although declining trends in workplace violence have been reported in the USA,5 European data suggest that there have been increases in the incidence of workplace violence in many countries.1 6
In the province of Ontario, an amendment to the Occupational Health and Safety Act in 2010 required employers to assess the risks of workplace violence and harassment in their workplace, and to develop policies and procedures for investigating and handling workplace violence incidents, as well as developing communication and programmes to better protect workers.7 Despite the introduction of regulatory requirements to control the risks of workplace violence, the number of injuries attributed to workplace violence has not declined in Canada.8 9 For example, the number of injuries resulting in an absence from work attributed to workplace assaults has increased over the last decade in Canada and the percentage of all workers’ compensation claims due to violence at work has almost doubled from 1.7% of all claims in 2004 to 3% of all claims in 2013. In contrast, the number of lost-time compensation claims due to all other causes has declined by 30% over this same time period.10
It is important to understand if the increasing number of injuries arising from workplace violence in Canada is due to changes in the nature of work or distribution of work across industries; and if changes in rates of injury arising from workplace violence are concentrated in specific occupations. While European research suggests that changes in work conditions (such as increasing computer work and frequent contacts with clients) and industrial mix (public administration sector or healthcare and education sector) explain only a fraction of the increases in self-reported workplace violence between 1995 and 2005,1 similar analyses have not been conducted in Canada.
Concepts of gender (social/structural differences between men and women) and sex (biological, psychological and environmental vulnerability differences) may be important contributors to the risk of workplace violence.11–14 Since men and women tend to hold different occupations,15 and be assigned different roles/tasks within the same occupation,16 we would expect that the risk of workplace violence for men and women may differ in general, and this risk may be exacerbated, or reduced, depending on the occupation or industry group under examination.12 17 Developing a better understanding of these factors may also lead to the development of more effective approaches for the prevention of workplace violence.
In this study, we estimate trends in the incidence of injury arising from workplace violence in Ontario from two independent population-based data sources. The study has a specific focus on describing important differences in injury incidence between men and women.
Methods
This study used two population-based data sources to estimate injury incidence rates arising from workplace violence in the Canadian province of Ontario: 1) lost-time worker’s compensation claims filed with the Ontario Workplace Safety & Insurance Board (WSIB) over the period of 2002–2015 and 2) records of emergency department (ED) visits over the period 2004–2014.
Lost-time compensation claims for injury attributed to workplace violence
The WSIB is the exclusive provider of workers’ compensation insurance in Ontario. Approximately 70% of the Ontario labour force are employed by firms with an obligation to register for insurance coverage providing wage replacement and the reimbursement of healthcare services for work-related injuries and illnesses. Those excluded (or not specifically included) from coverage with the WSIB include self-employed and domestic workers and the majority of the financial services sector.12 18
WSIB administrative records for injuries resulting in wage replacement benefits (referred to as lost-time claims (LTA)) contain information of the date of the injury, the employer’s economic sector as well as the gender, birth date and occupation of the injured worker. In addition, these records include standardised codes (using CSA Z795 coding system)19 classifying injury characteristics: the nature of injury, the part of body involved, the source of injury or disease and the event or exposure. In this study, the measure of event leading to injury was used to identify injuries attributed to workplace violence, specifically ‘assaults and violent acts by person(s), animals or other unspecified sources’.
Emergency department visits for the treatment of injury attributed to workplace violence
The National Ambulatory Care Reporting System (NACRS) was established by the Canadian Institute for Health Information in 1997, containing records of individual visits to facility-based ambulatory care services, primarily EDs in acute care hospitals. In July 2000, the province of Ontario mandated the reporting of all ED visits to NACRS.20 There are over 5 million annual ED visits in the province of Ontario recorded in the NACRS. For the purposes of this study, we obtained extracts of 8 987 023 NACRS records reported in the province of Ontario over the period 2004– 2014 for persons aged 15–64 years. The clinical determination of a work-related cause of the injury or illness presenting for ED treatment is documented by a ‘responsibility for payment’ code indicating the WSIB. This coding reflects the opinion of the treating physician that the injury is work-related, and occurs independently of the registration or acceptance of a workers’ compensation claim, and does not consider differences in eligibility for workers’ compensation in the Ontario labour market.20 There were 1 131 797 visits for the treatment of work-related injury/illness among working age adults. Variables included in extracted records were gender, age, visit type, triage date, triage time and a series of up to 10 fields documenting the main problem and the external cause of injury coded to the Canadian enhancement of the International Classification of Diseases, 10th Revision (ICD-10-CA).21 ED records that attributed the external cause of injury to assault (X92-Y09) were classified as injuries attributed to workplace violence.
Analytic methods
We used the Canadian Labour Force Survey (LFS) (Statistics Canada, 2003)22 to estimate the Ontario population at risk for injury arising from workplace. The LFS follows a complex, rotating panel sample design to efficiently estimate monthly changes in the Canadian labour force.20 22 To account for the different employment hours commonly worked by men and women and across age groups, all denominator counts were presented as full-time equivalents (FTEs). For the denominators of injury rates based on WSIB lost-time claims, LFS estimates were restricted to economic sectors with mandatory WSIB insurance coverage (for further information of this method, see Smith et al.).23 For the workplace assault injury rates from NACRS data, LFS estimates were calculated from the entire labour market, to be consistent with the NACRS records extracted.
Analysis
Over the period 2002–2015, there were 29 908 lost-time claims registered with the WSIB where the event associated with the claim was an assault or violent act. One hundred and eighty-six claims (0.6%) did not have the industry codes (Canadian Standard Industrial Classification (SIC) or The National Occupational Classification (NOC) codes) reported and could not be identified of the coverage group required by the WSIB, therefore were excluded. Another 7822 claims (26.15%) were under the mixed coverage group and 671 (2.24%) were in the voluntary coverage group. These claims were excluded from the analysis as the proportion of the labour force in Ontario who are covered by the WSIB within each of these groups is unknown.23 One more claimant was excluded because of missing date of birth. In total, there were 21 228 (70.98%) LTA violence claims included in our study, whose claimants were 15 years or older at the time of the claim. Among those LTA claimants who were excluded from the study, they were more likely to be female (p<0.0001) and younger workers aged between 15 and 24 years (p0.0001). For NACRS records, there were 13 245 ED visits between 2004 and 2014 where the ICD-10 code indicated an assault and the payment code indicated the injury was work-related.
Descriptive analyses reported the annual incidence rate per 1000 FTEs for injury attributed to workplace violence, stratified by gender and 10-year age groups. Age-adjusted standardised rates per 1000 FTEs were calculated for males and females using direct method. The 95% CIs of the age-adjusted standardised rates were calculated using the method based on the Gamma distribution,24 which provides a more conservative estimates of the variance and accounts for sampling errors. Regression models were used to assess the trend of the workplace injury rates due to assaults/violent acts over years.
Industry-specific claim rates due to assaults were examined using WSIB claims for the education, healthcare and other industries. Claim rates were stratified separately for men and women. The grouping of assault claims into these three broad industry categories is a reflection of the uneven distribution of lost-time claims across industry groups, with very low numbers of lost-time claims reported across age and sex groups in other industry groups, resulting in them all being combined to avoid sparse data. This analysis could not be replicated in the ED visits as no occupation or industry information is available in the ED records. The above standardised rates and corresponding CIs were calculated using SAS V.9.3.
We also examined the trends of the assaults/violence claim rates between male and female workers during the period of 2002–2015 using the Joinpoint Trend Analysis Software available free through the National Cancer Institute.25 The Joinpoint program analyse the data to find the best models that summarise the trend over years and use a Monte Carlo permutation method to test whether an apparent change in trend is statistically significant. The average annual per cent change (APC) is a method which uses the underlying Joinpoint model to compute a summary measure over a fixed prespecified time interval.
Results
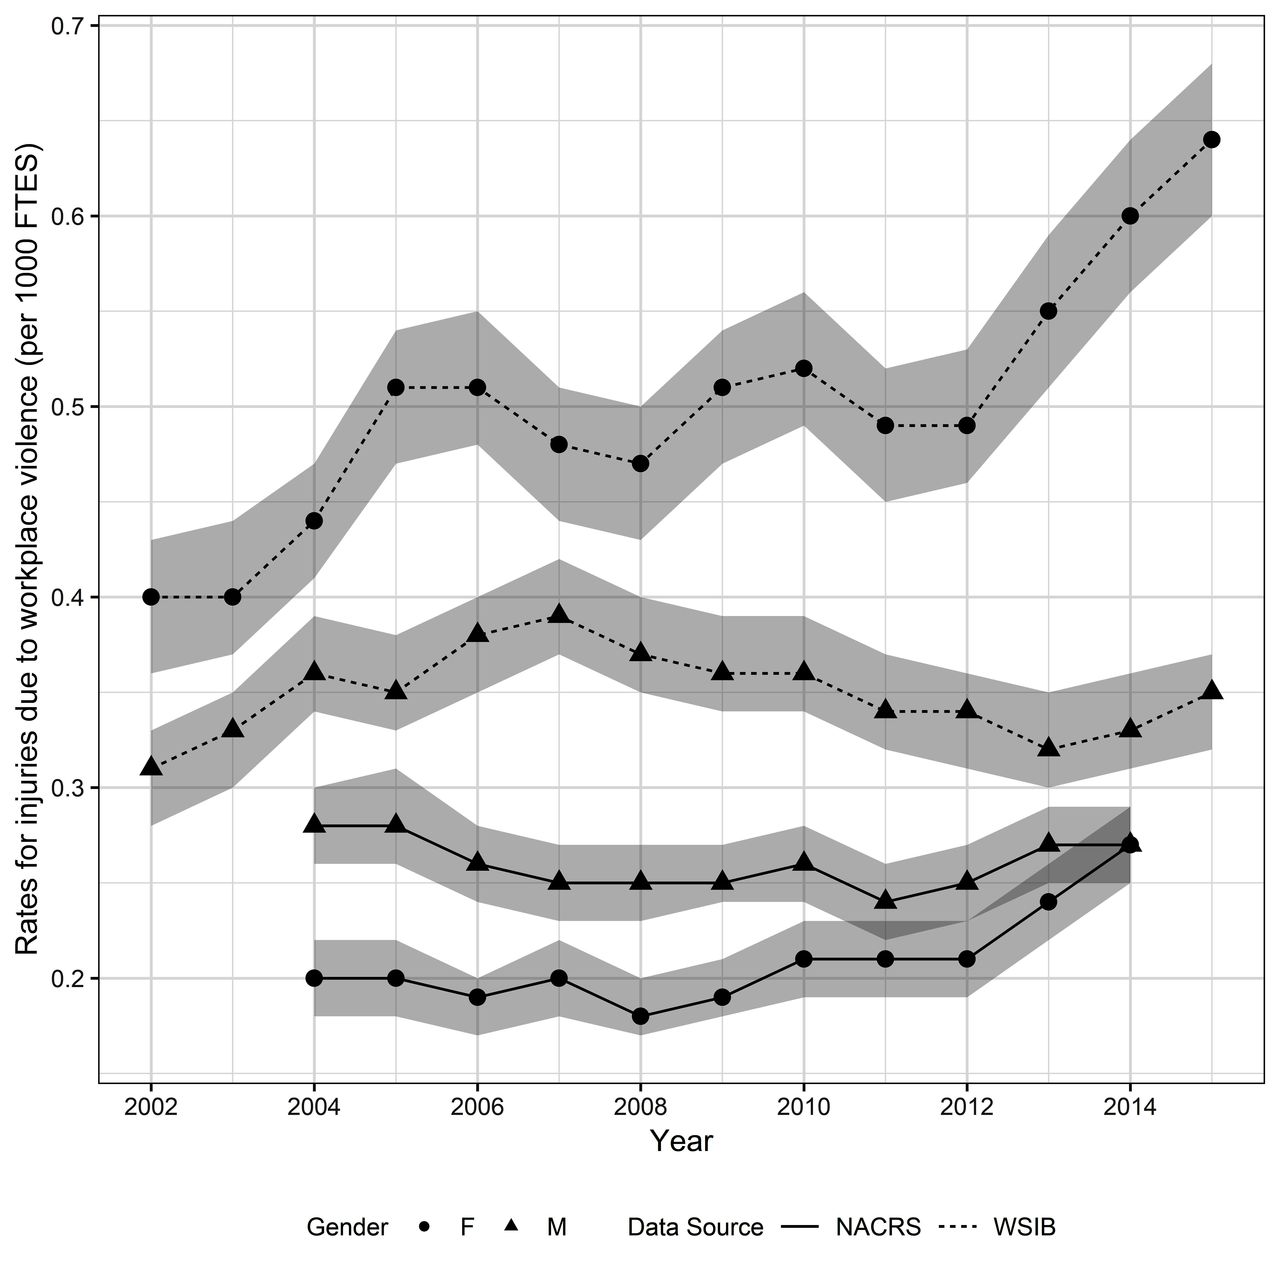
Table 1 reports the lost-time claim rates for injuries due to workplace violence and aggression in Ontario from 2002 to 2015. Rates for male workers were relatively stable, in the range of 0.3–0.4 per 1000 FTEs, although there was a rise in rates between 2002 and 2007 followed by a decline in the second half of the period. Over this same period, rates for women increased from 0.40 per 1000 FTEs in 2002 to 0.64 per 1000 FTEs in 2015. The annual lost-time claim rates for women were consistently higher than men, with the incidence rate ratio increasing from 1.30 in 2002 to 1.86 in 2015. Figure 1 shows the trends of injury rates due to workplace violence with 95% Gamma Confidence Interval by gender from two different data sources. The Jointpoint analysis confirmed the increasing trend of the violence injury rates of female workers over this period.
Lost-time injury incidence rates due to workplace violence or aggression, by sex (Ontario 2002–2015)

Injury incidence rates due to workplace violence by sex from WSIB lost time claims (WSIB) and hospital Emergency Department visits (NACRS). Ontario 2002 to 2015.
Table 2 reports rates of ED visits for the treatment of injury attributed to workplace violence and aggression. Men experienced slightly higher rates of ED visits than women, with male injury rates in the range of 0.24–0.28 per 1000 FTEs during the study period. The rate of injury attributed to workplace violence and aggression among women gradually increased over the observation period and the average annual per cent increase in the rate of female ED visits was 2.69%. It shows that both data sources confirmed an increase in rates of workplace violence among women; however, the relative difference in rates between men and women varies between the two data sources.
Emergency department visits for the treatment of injury attributed to workplace violence, by sex (Ontario 2004–2014)
Table 3 presents gender-stratified compensation claim rates for injury attributed to violence and aggression for the education sector, the healthcare sector and for all other sectors. Within the education sector, the compensation claim rate increased for both women (APC: 7.04%) and men (APC: 4.06%). The relative risk of compensation claims for injury attributed to violence was consistently higher for women compared with men in education, peaking at 6.19 in 2013. In the healthcare sector, compensation claim rates declined moderately over the study period among both men and women, with the largest decline observed among men. In contrast to the education sector, the relative risk of compensation claims for injury attributed to violence was consistently lower for women compared with men. The percentage of annual decrease among men almost doubled the decrease of women. The larger decline in assault claim rates for men compared with women, as evaluated by the coefficient of interaction between gender and time, was statistically significant (which is for men compared with women=−0.058, p=0.04). However, assault rates were still consistently higher among men compared with women over the study period.
Lost-time injury incidence rates due to workplace violence or aggression, by sector and sex (Ontario 2002–2015)
Within other industries, compensation claim rates for men were stable over the observation period, while rates among women increased slightly (APC: 1.38%). Male and female compensation claim rates were generally similar over the study period.
Discussion
Using two independent data sources, this study examined rates of work-related injury due to violence and aggression among men and women in Ontario over the period 2002–2015. Both workers’ compensation claim rates and ED visits suggested that rates of workplace assaults or violent acts among men were stable over the study period, while corresponding rates among female labour force participants have increased approximately 2.7% per year. When looking into specific industries, we observed an increase in workers’ compensation violence claims from workers in the education sector, compared with the healthcare and other industry groups. While increases in rates of violence (as assessed by workers’ compensation claims) were observed for both men and women in the education sector, increases were stronger among female workers than among male workers with the relative risk of workplace violence for women (compared with men) being at least fivefold for the second half of the study time period. These results point to an overall increase in male/female inequalities in injury attributed to workplace violence in Ontario between 2002 and 2015.
Previous research on risk of workplace violence has been inconsistent in relation to relative risk differences between men and women. Some studies using population-level data have reported that men are at a lower risk of workplace violence compared with women,1 26 27 others have found men to be at a higher risk5 28 and still others have reported no difference in risk for men and women.4 29 30 Our study adds to this research literature, by demonstrating that the relative risk of violence between men and women can change over time and differs across industries sectors within the same time period.
A key limitation that warrants consideration in the interpretation of the results of this study is the accuracy of workers’ compensation data and ED presentations to capture incidents of workplace violence in Ontario.20 To examine the influence that systematic changes in either the submission of workers’ compensation claims or use of ED services related to violence between men and women may have had on our results, we conducted a parallel set of analyses examining time trends in workers’ compensation submissions for non-violent events, and ED presentations for violence not attributed to work (see online supplementary appendix). These analyses showed that the relative decline in workers’ compensation claims for non-violent events was similar for men and women (average APC of men −6.7% with 95% CI −7.5% to −5.9% vs average APC of women −5.9% with 95% CI −6.8% to −5.0%), suggesting that male/female differences in the reporting injuries to workers’ compensation do not explain the differing trends observed in the workers’ compensation data. We observed a stable rate for ED visits for non-work violence among women (average APC=−0.37%, 95% CI −1.1% to 0.4%), while a decline was observed in non-work-related violence among men with average APC of −2.2% (95% CI −3.9% to −0.4%). This suggests that greater use of ED services for violence in general is also an unlikely explanation for the increases observed in female rates of workplace violence. In addition, the elevated rate of violence for men compared with women in healthcare is consistent with rates of self-reported violence between male and female nurses from the 2005 National Survey of the Health of Nurses12 31 (44% for men vs 28% for women; rate ratio=0.64). This suggests that while rates of injury attributed to workplace violence in workers’ compensation claims is considerably lower (over 200 times lower) than self-reported information on the frequency of exposure to episodes of violent or aggressive behaviour, the relative risk of violence between men and women as assessed by both data sources is consistent.
Supplemental material
The strengths of our study include using two independent data sources of population-level information to understand the industry-specific relationship between gender/sex and workplace violence in Ontario. The evidence from our study provided information on demographic, occupational and work contexts that are associated with an increased risk of workplace violence, which potentially are useful for developing effective primary prevention approaches to reduce workplace violence. The repeated cross-sectional design of the study which covered more than 10 years of observation provided the temporal trends of the incidence of workplace violence, compared with the existing literatures which often conducted at one point in time.30 32 In addition, our study broadens the examination of workplace violence beyond the healthcare sector, where much of the current research on workplace violence has been based.
We also observed differences in rates of workplace violence for men and women in ED data compared with workers’ compensation data. While both data sources confirmed an increase in rates of workplace violence among women, this increase widened male/female inequalities among workers’ compensation claims but reduced them to parity in ED data. These differences were due to a greater concordance between rates of workplace violence from both data sources among men, relative to women.
Previous studies have demonstrated differences between ED visits and workers’ compensation levels, although these differences are dependent on the type of injury.20 33 The differences between the male and female rates of workplace violence in worker’s compensation data compared with ED records could be the result of several factors. Studies have demonstrated that responses to violence or acts of aggression at work may differ among men and women, with men more likely to respond to aggression in direct ways that can escalate the situation to one of violence, compared with women who may be more likely to use less direct, or problem-solving responses, such as removing themselves from the situation.34 As a result, acts of workplace violence may result in more severe injuries among men compared with women, which may be more likely to result in ED presentations. It is also possible that a proportion of workplace violence incidents that are reported to the WSIB do not require medial attention in an ED, but due to psychological consequences require some time off work. In addition, differences between men and women in the types of violence experienced (eg, sexual vs physical) may also lead to differences in rates observed in workers’ compensation compared with ED sources.35 Unfortunately, measures of severity or the ability to distinguish between types of violence were not available in the data sources used for this study to further investigate these mechanisms, but this is an important area for future research.
In conclusion, this study demonstrates that male/female inequalities in workplace violence are increasing in Ontario, driven by an increase in workplace violence among women, in particular those in the education sector. Although the current study demonstrates a consistency in the findings from workers’ compensation and ED data, future research could examine the concordance of each data set at the individual level using record linkage. This study also highlights the potential for routine injury surveillance to better understand inequalities in risk of workplace violence over time. In addition, more detailed information on types and severity of injuries sustained by male and female workers due to workplace violence would provide better pictures for policy makers to put more effective prevention measures in place. Despite calls for the development of a surveillance system for violence in Canada36 and elsewhere32 36 37 for more than a decade, examinations of workplace violence remain opportunistic, occupation specific and are often conducted at one point in time.30 32 36 While the use of administrative healthcare and workers’ compensation has limitations, analyses like the one undertaken provide a starting point on which more active surveillance of workplace violence incidents can be based. Given the negative physical and psychological impacts of workplace violence, more active surveillance and examination of changes in risk for workplace violence over time within specific labour force subgroups is warranted.
Acknowledgments
PMS is supported through a Canadian Institutes for Health Research Chair in Gender, Work and Health. The authors would like to thank Victoria Landsman for assistance in access to CIHI emergency presentation counts.
References
Footnotes
Contributors PMS and CM conceived the study and the design of the study methods. CC contributed to the analysis of the study data and drafted the initial manuscript. All authors made editorial contributions to the final paper. All authors have participated sufficiently in the conception and writing of this manuscript, we consent to have our names on it.
Funding Funding support for this research was provided by a grant from the Ontario Workplace Safety and Insurance Board. The Institute for Work & Health operates with the support of the Province of Ontario.
Disclaimer The views expressed in this manuscript are those of the authors and do not necessarily reflect those of the Province of Ontario.
Competing interests None declared.
Patient consent Not required.
Ethics approval University of Toronto Health Sciences.
Provenance and peer review Not commissioned; externally peer reviewed.
Correction notice This article has been corrected since it first published. It is now open access.