Article Text

Abstract
Objective To evaluate mortality risks of angiosarcoma of the liver (ASL), primary hepatocellular carcinoma (HCC) and other cancers among 9951 men employed between 1942 and 1972 at 35 US vinyl chloride (VC) or polyvinyl chloride plants followed for mortality through 31 December 2013.
Methods SMR and time-dependent Cox proportional hazards analyses were used to evaluate mortality risks by cumulative VC exposure.
Results Liver cancer mortality was elevated (SMR=2.87, 95% CI 2.40 to 3.40), and ASL and HCC were strongly associated with cumulative VC exposure ≥865 parts per million-years (ppm-years) (ASL: HR=36.3, 95% CI 13.1 to 100.5; and HCC: HR=5.3, 95% CI 1.6 to 17.7 for ≥2271 ppm-years). Excess deaths due to connective and soft tissue cancers (SMR=2.43, 95% CI 1.48 to 3.75), mesothelioma (SMR=2.29, 95% CI 1.18 to 4.00) and explosions (SMR=3.43, 95% CI 1.25 to 7.47) were seen. Mortalities due to melanoma, brain cancer, lung cancer and non-Hodgkin’s lymphoma were not increased or associated with VC exposure.
Conclusion The association between VC and ASL first reported in this cohort 44 years ago persisted and was strongest among workers most highly exposed. VC exposure also was associated with HCC mortality, although it remains possible that misdiagnosis of early ASLs influenced findings.
- vinyl chloride
- angiosarcoma of the liver
- hepatocellular carcinoma
This is an Open Access article distributed in accordance with the Creative Commons Attribution Non Commercial (CC BY-NC 4.0) license, which permits others to distribute, remix, adapt, build upon this work non-commercially, and license their derivative works on different terms, provided the original work is properly cited and the use is non-commercial. See: http://creativecommons.org/licenses/by-nc/4.0/
Statistics from Altmetric.com
What this paper adds
Although exposure to high concentrations of vinyl chloride (VC) is an established cause of angiosarcoma of the liver (ASL), few studies have explored the shape of the exposure–response curve.
Updating mortality through 2013 of the US industry-wide vinyl chloride cohort identified excess mortality due to hepatocellular carcinoma (HCC), and the relative risk increased with increasing exposure to VC, showing similar patterns to ASL.
No clear exposure–response relationships were observed for mortality from other cancers, including lung cancer, brain cancer, non-Hodgkin’s lymphoma or melanoma.
Risks of ASL and HCC were only elevated among workers with very high estimated cumulative exposures, that is, over 1000 parts per million-years, and after long latencies (median latency was 36 and 48 years, respectively, for ASL and HCC).
Introduction
Three cases of angiosarcoma of the liver (ASL) diagnosed in 1974 among polyvinyl chloride (PVC) reactor cleaners at the BF Goodrich facility in Louisville, Kentucky1 2 prompted an epidemiological investigation of more than 10 000 men employed before 1972 in the US vinyl chloride (VC) industry (plus one Canadian facility).3 4 Mortality for this cohort was updated through 19885 and 1995,6 each update indicating elevated mortality from ASL. Associations between VC exposure and brain cancer,6–9 malignant melanoma,10–12 lymphatic and haematopoietic malignancies (LHM)7–9 and soft tissue sarcoma6 have also been reported.
The early reports in the US cohort estimated maximum level exposed for >12 months (classified as high, medium or low) and an exposure index4; later evaluations used length of exposure, latency, age at first exposure, calendar year of first exposure and type of products as exposure surrogates.5 6 Other early studies of workers exposed to VC used history of reactor cleaning and duration of employment as surrogates for intensity of exposure and cumulative exposure, respectively.4 13 14 However, none quantitatively estimated VC exposure for each cohort member.
A European multicentre study estimated individual quantitative exposures to VC among 12 700 male workers at 19 factories in four countries,15 16 and specifically examined the exposure–response curve for VC and ASL. This study also reported an association with hepatocellular carcinoma (HCC). Cumulative exposure estimates were used to evaluate mortality risks of HCC17 and cirrhosis of the liver18 in a subcohort of the European multicentre study. Whether and at what levels VC exposure might cause HCC were debated.9 16–18 Because most studies lacked histopathological evidence,19 associations seen with non-ASL liver cancer and soft tissue sarcoma may reflect underdiagnosed and/or misclassified ASLs.20 In 2007 and 2009, the International Agency on Research in Cancer (IARC) evaluated the carcinogenicity of VC and determined that VC causes HCC as well as ASL.19 21
This paper reports mortality updated through 31 December 2013 for men engaged in the manufacture of VC or PVC resin at any of 35 factories in the USA. The objectives were to evaluate exposure–response relationships for mortality from ASL and HCC, based on quantitative VC exposure estimates for each cohort member.
Methods
Cohort definition
Details on the enumeration of this cohort have been published.3 4 The original cohort included 10 109 men employed for at least 1 year before 1972 at any of the 37 factories in the USA, plus one factory in Canada.3–6 We restored more than 1300 cohort members previously lost to follow-up.6 In addition, we identified the earliest dates employees separated from each facility as an indicator of complete record-keeping (facility enumeration date, which ranged from 1942 to 1968 for the 37 facilities). For the current update, we excluded 158 workers: 45 from a single facility located in Canada and for whom vital status could not be searched; 85 from a single small monomer factory, nearly half of whom lacked personal identifiers necessary for follow-up; and 28 determined to have left employment before the facility enumeration date. This left 9951 workers from 35 facilities, hereafter called the ‘full’ cohort. In addition, we analysed an ‘inception’ subcohort of 7273 workers, excluding 2678 workers actively working on the facility enumeration date. We further analysed an inception subcohort of 6701 cohort members by restricting follow-up to workers alive as of 1973 (excluding 443 deaths and 129 lost to follow-up). Comparing results across subcohorts allows examination of potential selection and survival bias as compared with the full cohort, which included many workers hired 10 or more years earlier and surviving to the facility enumeration date.
Exposure assessment
Individual VC exposure estimates were derived for each cohort member for this update. The exposure assessment and reconstruction are described in detail in the online supplementary text. Briefly, job and department assignments were used to assign each cohort member to similar exposure groups (SEGs) for PVC or VC operations. The SEGs for PVC operations were close contact polymer operations, polymer finishing operations, laboratory, maintenance and support, and administration and supervision. The SEGs for VC operations were monomer rail or tank car operations, monomer production, maintenance and support, laboratory, and administration and supervision. Cumulative exposure was calculated by multiplying summary VC concentrations from facility-specific and calendar-specific job exposure matrices by duration of time in the SEG and summing these over the work history for each cohort member.
Vital status ascertainment
Vital status was updated through 31 December 2013 by searching databases of the US Social Security Administration (SSA) and for deaths occurring since 1979, the National Death Index (NDI) of the US National Center for Health Statistics (NCHS). For deaths prior to 1979, and for uncertain NDI matches, we requested death certificates from state vital statistics offices. We additionally performed online genealogical research and confirmed identity and date of death via death certificates, as needed. For deaths occurring since 1979, we used the NDI-coded underlying cause of death. We also obtained death certificates where the NDI cause of death code was consistent with liver cancer, connective and soft tissue cancer, or unknown cancer to identify the most specific underlying cause of death. Prior to the 10th revision of the International Classification of Diseases (ICD) (before 2000), ASL was reported on death certificates as ‘liver cancer’ (eg, ICD-9 155.0 or ICD-9 155.2). When not coded on the death certificate, underlying cause of death was coded by a nosologist according to ICD-9. We also reviewed cases reported to a worldwide ASL register maintained by the European Council of Vinyl Manufacturers.22 As of 2011, the register included 234 ASLs, 60 of which occurred in the USA; however, the extent of coverage and validity of the diagnosis are not known.
Person-time at risk and reference rates
Person-time at risk accrued starting 1 year after first employment or the cohort enumeration date for any study facility, whichever was later, starting 1 January 1942. Person-years accrued until date of death, attaining age 85, or 31 December 2013. We censored cohort members at age 85 as (1) causes of death reported on death certificates for the very old are generally less reliable23 24; (2) causes of death at very old ages may less likely reflect occupational exposures (with the exception of mesotheliomas, with latencies commonly between 30 and 60 years); and (3) reference rate age categories over 85 are open-ended. For individuals whose vital status could not be determined, person-time was censored as of the date of last employment.
We obtained mortality rates by age and calendar interval for 119 cause-specific categories of cause of death from the National Institute for Occupational Safety and Health (NIOSH) for the USA and for each state where a study facility was located.25 Because NIOSH mortality rates combine liver cancer with gall bladder and biliary tract cancers, we also obtained state and national rates for liver cancer (ICD-9 155.0, 155.2; ICD-10 C22.0, C22.2-C22.4, C22.7, C22.9). These were extracted from the NCHS mortality files obtained using the Surveillance, Epidemiology and End Results Cancer Query System.26 Rates for white men were used in all analyses, because 96.8% of the 3939 men with known race were white.
Statistical analysis
SMRs and exact 95% CIs27 were calculated for all cause-specific categories of death using SAS V.9.3 software. Exposure indicators included duration of employment, time since first exposure, age at first exposure, year of hire, year of birth and cumulative exposure quintiles. Manufactured product (monomer vs PVC resins) and geographic region were also evaluated.
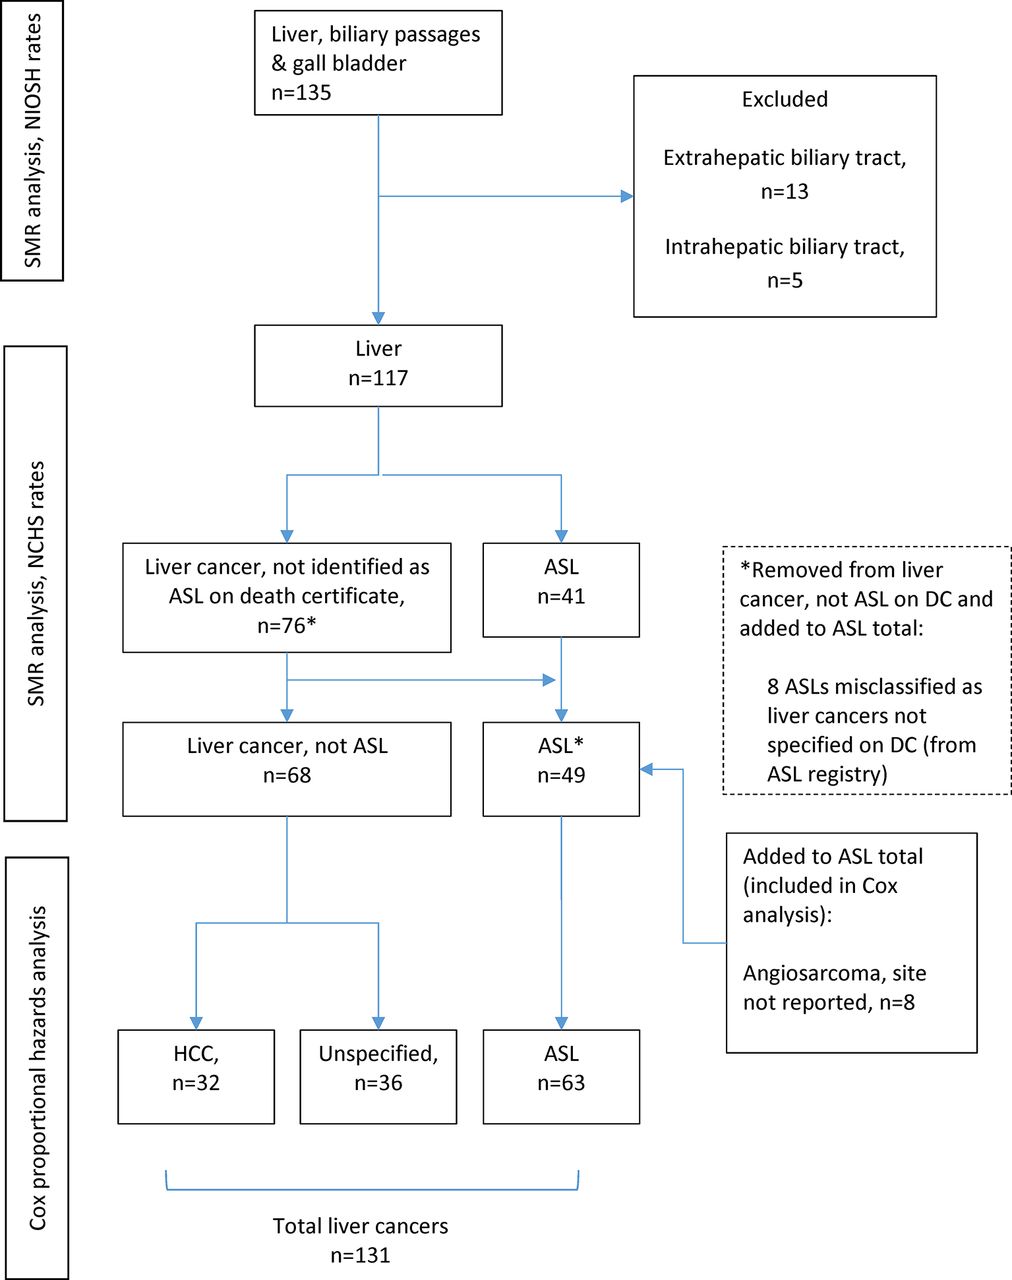
We evaluated the time-dependent relationship between estimated cumulative VC exposure and mortality from selected causes of death using Cox proportional hazards models. Cox analyses were performed using Stata V.12.1. Attained age was used as the time scale variable in all Cox models. Year of birth, age at hire, year of hire, years since hire, duration of employment and plant type (VC vs PVC) were evaluated as independent risk factors for liver cancer: of these, an association was found only for duration of employment. Categorical cumulative exposure for the entire cohort was modelled based on quintiles (<63, 63 to <287, 287 to <865, 865 to <2271 and ≥2271 parts per million-years (ppm-years)). Cumulative exposure was lagged by 10, 20, 30 and 40 years to evaluate latency for ASL and HCC. Duration of employment was also categorised based on quintiles for the entire cohort (<5, 5 to <12, 12 to <18, 18 to <28 and 28 or more years) and unadjusted models fit for non-liver cancer outcomes. Using these quintile cut-points, we ran unadjusted models of mortality from ASL, HCC and all other liver cancers combined (figure 1), as well as brain cancer, lung cancer, non-Hodgkin’s lymphoma (NHL), melanoma, and cancers of connective and soft tissues (defined by NIOSH and including angiosarcoma not otherwise specified), selected because they had been identified as potentially related to VC.6–12 16 21 28 Specific ICD codes by category can be found in the documentation for NIOSH life table analysis system mortality programme.29 We also evaluated non-malignant causes of death previously reported to be increased in the cohort, including cirrhosis of the liver.
Because most liver cancer deaths were observed in the highest cumulative exposure categories, we redefined cut-points based on quintiles for the liver cancer decedents: <1021 (reference), 1021 to <3301, 3301 to <5686, 5686 to <10 551 and ≥10 551 ppm-years. We similarly created new categories of duration of employment: <14, 14 to <21, 21 to <26, 26 to <31 and ≥31 years.

Liver cancer deaths included in each analysis. ASL, angiosarcoma of the liver; DC, death certificate; HCC, hepatocellular carcinoma; NCHS, National Center for Health Statistics; NIOSH, National Institute for Occupational Safety and Health.
Results
The full cohort of 9951 workers accrued 401 524 person-years at risk with 40.4 mean (median=43.8) years of follow-up. The average year of birth was 1927 (median=1928), average duration of employment was 16.4 years (median=14.9), average year of hire was 1956 (median=1955) and average age at hire was 28 years (median=26). A total of 5636 (56.6%) cohort members died before their 85th birthday, and cause of death was determined for 99.4%. Another 1196 (12% of the cohort) were censored at age 85. Only 216 (2.2%) were lost to follow-up.
Based on state referent rates, mortality from all causes combined (SMR=0.87, 95% CI 0.85 to 0.89) and all heart disease (SMR=0.86, 95% 0.82 to 0.90) showed clear deficits (table 1), consistent with earlier evaluations of this cohort. Mortality from lung cancer and laryngeal cancer also were lower than expected (table 1). For most of the other non-liver cancers of a priori interest (brain cancer, melanoma and NHL), mortality was not significantly elevated. Mortality was significantly increased for cancers of the connective and soft tissues (SMR=2.43, 95% CI 1.48 to 3.75) and cancers of the liver, biliary passages and gall bladder (combined) (SMR=2.87, 95% CI 2.40 to 3.40, based on 135 deaths) (table 1). Mortality from liver cancer only was clearly elevated (SMR=3.68, 95% CI 3.04 to 4.41), based on 117 deaths (table 1). Mortality was also increased for mesothelioma (SMR=2.29, 95% CI 1.18 to 4.00) and explosions (SMR=3.43, 95% CI 1.25 to 7.47, 6 deaths). Mortality patterns were similar for the inception subcohort and the inception subcohort with follow-up beginning in 1973 (see online supplementary table 1).
Observed and expected deaths, SMRs and 95% CIs for selected causes* for 9951 vinyl chloride workers†
Mortality risks by cumulative exposure and duration of employment
Cumulative exposure was not associated with mortality due to melanoma, brain cancer, lung cancer or NHL (table 2). For cancers of connective and soft tissues, a pattern of increased risk with cumulative exposure was observed, although HRs were imprecise due to only one death in the referent category. Nevertheless, risk was highest in the highest cumulative exposure category (HR=8.9, 95% CI 1.1 to 69.8 for ≥2271 ppm-years) (table 2). Closer inspection, however, revealed that 8 of the 20 connective tissue cancer deaths were due to ‘angiosarcoma (site not specified)’ and were included in the subsequent analyses of ASLs. Increased risk estimates were seen for lung cancer, cirrhosis of the liver, all non-malignant respiratory disease and COPD; however, these increases were not statistically significant or related to increasing cumulative exposure (table 2), and did not differ between the inception cohort (see online supplementary table 2) and the inception cohort with follow-up starting in 1973 (see online supplementary table 3).
Mortality from selected causes of death by categories of cumulative exposure* to vinyl chloride from Cox regression models†
Duration of employment also was not associated with mortality from any of the causes of death of a priori interest (see online supplementary tables 4–6). Most higher duration of employment categories showed decreased risks compared with the <5 years’ category.
Liver cancers
SMR results for liver cancers, stratified by quintiles of year of birth, year of hire, age at hire, duration of employment, time since hire, as well as region and facility type demonstrated increased mortality (see online supplementary table 7). For Cox proportional hazard analyses of ASL, we included 41 of the 117 liver cancer deaths (table 1) for which the death certificate specifically identified ASL (figure 1). In addition, 8 of the 76 remaining liver cancer deaths had been reported to the Worldwide ASL Register and confirmed based on histopathology. We also identified six histologically confirmed ASL deaths in the registry for which the underlying cause of death on the death certificate was lung cancer, pancreatic cancer, sepsis or cirrhosis of the liver (figure 1). Finally, we included as ASL eight deaths coded as angiosarcoma of unspecified site for a total of 63 ASL deaths. From death certificates, we also identified 32 deaths with underlying cause coded as HCC.
Angiosarcoma of the liver
The median latency for ASL deaths was 36 (range: 13.5–55.9) years. Because no ASL deaths occurred among those in the referent category of cumulative exposure (<63 ppm-years), and only one in the next category, we collapsed the first three quintiles of exposure to create a new referent category. Fifty (79%) of the ASLs were in the highest exposure quintile (≥2271 ppm-years), generating an HR of 36.3 (95% CI 13.1 to 100.5) (table 3). When categories were based on quintiles of exposure among all liver cancer deaths (high cut-points), ASL risk increased with cumulative exposure (table 3). Compared with workers with <1021 ppm-years, workers exposed to ≥10 551 ppm-years had an HR of 73.6 (95% CI 28.8 to 188.4, based on 16 deaths). When exposure was lagged 10, 20, 30 or 40 years, risk of ASL was significantly increased only for workers in the two highest quintiles of exposure based on low cut-points when compared with the referent group (see online supplementary table 8). Risk estimates for cumulative exposure quintiles based on high cut-points and lagged by 10, 20, 30 and 40 years showed similar patterns to unlagged risk estimates (see online supplementary table 9). Risk of ASL increased with increasing duration of employment (see online supplementary table 10).
Risk estimates for ASL, HCC and unspecified liver cancer by cumulative exposure from Cox regression models
Hepatocellular carcinoma
The median latency for HCC deaths was 48 (range: 31.5–66.6) years. Three HCC deaths occurred in each of the two lowest quintiles of exposure. When compared with the referent (<63 ppm-years), HCC did not show increased mortality risk except for the highest quintile (≥2271 ppm-years) of exposure (HR=5.3, 95% CI 1.6 to 17.7) (table 3). When exposure cut-points were based on quintiles of cumulative exposure for all liver cancer deaths, the HRs for cumulative exposure ≥3301 ppm-years were statistically significantly increased compared with workers with <1021 ppm-years, and rose to 18.8 (95% CI 6.8 to 51.9) among those with ≥10 551 ppm-years (table 3). When cumulative exposures using quintiles based on low cut-points were lagged by 10, 20, 30 and 40 years (see online supplementary table 8), HCC risks were similar to risks for unlagged cumulative exposure. HCC risk was significantly increased (HR=3.8, 95% CI 1.4 to 10.4) for 1021 to <3301 ppm-years lagged 30 years (high cut-points, see online supplementary table 9): other patterns of HCC risks by lagged cumulative exposure were similar to unlagged results. Similar to ASL risks, HCC risks increased with increasing duration of employment (see online supplementary table 10).
Liver cancers of unknown histology
A total of 36 liver cancers of unknown cell type were analysed separately. An increased HR of 3.6 (95% CI 1.2 to 10.6) was seen for the highest quintile (≥2271 ppm-years) when compared with the referent (<63 ppm-years). When exposure categories were based on quintiles of cumulative exposure for all liver cancer deaths, HRs were increased for all categories compared with workers with <1021 ppm-years; however, statistically significant increased mortality risk was seen for categories of exposure 3301 to <5686 ppm-years and >10 551 ppm-years (table 3). No association was seen between liver cancers of unknown histology and duration of employment (see online supplementary table 10).
The results of ASL, HCC and unspecified liver cancer models for the inception subcohort and the inception cohort with follow-up beginning in 1973 were similar to the results for the full cohort for cumulative exposure (see online supplementary tables 11 and 12) and for duration of employment (see online supplementary tables 13 and 14).
To more fully evaluate the shape of the exposure–response curve, we plotted the HRs for ASLs and HCCs by deciles of cumulative exposure among all liver cancer cases (figure 2). Patterns of increased risk with cumulative exposure were clear and the shape of the exposure–response curve was similar for ASL and HCC.

HR for ASL and HCC by deciles of cumulative exposure, based on the exposure distribution of all liver cancer cases. ASL, angiosarcoma of the liver; HCC, hepatocellular carcinoma; ppm, parts per million-years.
Discussion
This study followed 9951 men employed for 1 year or more in the North American VC industry cohort for mortality through 2013. A total of 63 ASLs and 36 HCCs were observed after an average follow-up of 40 years. Among the strengths of this study are the large cohort size, large proportion of cohort members exposed to very high VC concentrations and long follow-up — all critical to the identification of VC-related cancers, especially ASL and HCC, which are both rare and appear to have long latencies. New to this update, however, is the quantitative exposure assessment, providing time-dependent quantitative estimates of cumulative exposure for each cohort member, similar to the approach used in the European multicentre study.15 16 In both studies, exposure estimates were based on limited workplace air measurements. Industrial hygienists used professional judgement to create facility-specific job exposure matrices based on jobs assigned to similar exposure groups and calendar periods. In the US cohort, exposure measurements were numerous in 1973 and 1974, but sparser in earlier years. Exposure records, however, often lacked critical information on collection methods and sometimes even whether they were area or personal breathing zone samples. Despite imprecise cumulative exposure estimates, strong associations between cumulative exposure to VC and risk of ASL and HCC were observed, with clear evidence of exposure thresholds. No ASL was reported among workers exposed to <63 ppm-years and only one ASL was reported among workers with cumulative exposure 63 to <287 ppm-years (likely underestimated due to limited work history data). Therefore, ASL tended not to occur in workers with cumulative exposure below approximately 250 ppm-years. Risk of HCC was not increased among workers accumulating less than approximately 1000 ppm-years of VC exposure.
Mortality due to cancers other than liver and biliary tract was not elevated, with the exception of malignant mesothelioma (likely due to exposure to amphibole asbestos).30–32 Other investigators have reported increased risks of malignant melanoma10–12 and LHM7–9 among workers exposed to VC. However, the numbers of deaths reported in these studies were very small (ie, <5 observed). We found no evidence of increased mortality from these or any other cancers (table 1).
Excess mortality from brain cancer has been reported in smaller cohort studies conducted in Germany,8 Russia7 and Taiwan,9 as well as in previous updates of this cohort: followed through 1982 (SMR=1.80, 95% CI 1.14 to 2.71, based on 23 deaths)5 and followed through 1995 (SMR=1.42, 95% CI 1.00 to 1.97, based on 36 deaths).6 In this latest update, the small excess of mortality from brain cancer was further attenuated (SMR=1.27, 95% CI 0.95 to 1.66, based on 52 deaths) as 16 new brain cancer deaths were observed and 16 were expected. Brain cancer risk was not associated with cumulative exposure in the full cohort (n=52), the inception cohort (n=38) or the inception cohort with follow-up beginning in 1973 (n=31). These results suggest that even if a small excess of brain cancer mortality had occurred among members of this cohort, it was limited to early years and unlikely related to VC exposure (see online supplementary tables 2 and 3). Furthermore, the European study found no excess of brain cancer mortality (SMR=0.93, 95% CI 0.60 to 1.39) or incidence (SIR=0.91, 95% CI 0.55 to 1.42)16 and no exposure–response with any of the exposure indicators. Taken as a whole, the epidemiological evidence does not support the hypothesis that VC causes brain cancer.
Our results for the risks of cumulative exposure to VC and ASL mortality are consistent with those reported in the European study.16 Prior to the 10th revision of the ICD, ASL did not have its own ICD code, limiting valid ascertainment of ASL. Since ultrasound and CT scanning were introduced in the 1970s, diagnostic sensitivity improved considerably, and HCC is commonly diagnosed based on imaging, without histological confirmation.33 Nevertheless, a definitive diagnosis of ASL or HCC requires histopathological confirmation from a liver biopsy, and considerable potential for misclassification remains. Although we report a clear association between VC exposure and HCC mortality, the median latency for HCC deaths was 48 years, ranging from 31.5 to 66.6 years, and was considerably longer than the median latency for ASL deaths (36 years, range: 13.5–55.9 years). Also, the HRs for HCC increased with longer lagging periods up to 30 years, whereas lagging of exposure had little impact on ASL risk. While this may reflect a true difference in the risk for different liver cancer cell types, it also — at least in part — reflects the greater probability of misclassifying ASL as HCC in earlier decades.
Other investigators have reported increased risk of HCC with increasing cumulative exposure to VC9 16 17 34 35; however, most relied on small numbers. Ward and colleagues16 reported 10 cases of HCC in the European cohort followed for mortality and cancer incidence through 1997. Since then, Pirastu et al 17 reported 12 cases of HCC in the Italian subcohort of the European study. Du and Wang34 reported 6 HCCs among 12 primary liver cancers at five PVC plants in Taiwan. Wong et al 9 reported 18 HCCs, but no deaths from ASL, among 3923 male PVC workers employed between 1950 and 1992 in Taiwan and followed for mortality from 1985 to 1997.35 When follow-up was expanded from 1980 to 2007, 56 liver cancers were reported, but no ASLs.36 On the basis of these reports, the IARC stated there was strong evidence that VC exposure causes HCC, especially when coupled with observations that VC exposure is associated with cirrhosis of the liver, a known risk factor for HCC. In our study, we observed a deficit in mortality from cirrhosis of the liver and no clear association with cumulative exposure to VC. On the other hand, three of the deaths coded cirrhosis of the liver based on death certificates were reported as ASL by the Worldwide ASL Register. Our findings are consistent with the finding of the European study that also observed a deficit of cirrhosis, with no pattern of increasing risks with increasing cumulative exposure,16 and a meta-analysis of VC workers (which included 67 deaths from the 1995 update of this cohort).37 Thus, it appears unlikely that occupational exposure to VC causes liver cirrhosis.
Strong risk factors for HCC include chronic hepatitis B virus (HBV) and chronic hepatitis C virus (HCV) infection, as well as heavy alcohol consumption and obesity.38 Information on HBV, HCV, alcohol use and obesity was not available in our study and therefore could not be evaluated.
Other weaknesses of this study are similar to those of other historical cohort mortality studies, including reliance on incomplete or erroneous archival records, and especially cause of death information from death certificates from decades ago. We were unable to ascertain the specific liver cancer type for all cohort members identified as having a liver cancer, and the possibility remains that some classified as HCCs were actually ASLs.
Conclusions
This cohort of nearly 10 000 US workers occupationally exposed to VC — some at very high levels — found a strong healthy worker effect (HWE), with 857 fewer deaths observed in the full cohort than expected. As expected, the HWE reflects reduced cardiovascular disease mortality, with cancer mortality showing no such effect. Apart from a small excess of mesothelioma deaths, increased mortality was limited to liver cancers. Very high cumulative VC exposure was strongly associated with both increased ASL and HCC; however, risks were not increased among workers with cumulative exposure estimates below 1000 ppm-years. This threshold is approximately 25 times greater than would be accrued over a working lifetime at today’s exposure limit of 1.0 ppm, in place since 1975. In fact, no ASL death has been identified in this cohort among workers first employed since 1969. On the other hand, risks of ASL and HCC were highly elevated among workers with cumulative VC exposure exceeding 5000 ppm-years, roughly 125 times a working lifetime at today’s exposure limit. No other patterns of increased mortality risk were seen for other causes of death in the total cohort, an inception subcohort of 7273 workers hired on or after the facility enumeration date, or the inception subcohort of 6701 workers who were alive at the time the cohort was enumerated. After a follow-up of at least 40 years, and with 57% of the cohort now deceased, confidence is high that any additional follow-up of the cohort would show declining ASL and possibly HCC risks associated with historically very high VC exposures found in some jobs and workplaces prior to 1974.
Acknowledgments
The authors thank Robert Adams, CIH, CSP, and Craig Torres, CIH, for the exposure assessment and creation of the job exposure matrices. Their technical expertise and support were invaluable. The authors are grateful for technical assistance and data management provided by Rose Luippold (deceased), Amy Kaiser, Hilary Adam, Amy Lemire and Cynthia Lemire. The authors thank Dr Lillian Ingster, Michelle Goodier and Velida Juzbasic of the NDI, Sherry Barber of the SSA, and the many state vital statistics offices that provided expeditious service in response to data requests. Vital status and cause of death data were supplied by the NDI, SSA and numerous state departments of health, including Health Statistics and Evaluation Branch of the Colorado Department of Public Health and Environment (Denver, Colorado); Florida Department of Health (Jacksonville, Florida); Vital Statistics Administration, Maryland Department of Health and Mental Hygiene (Baltimore, Maryland); New Hampshire Department of Health and Human Services and the Secretary of State (Concord, New Hampshire); Division of Vital Records Administration, New Mexico Bureau of Vital Records and Health Statistics (Santa Fe, New Mexico); New York State Department of Health (Albany, New York); Pennsylvania Bureau of Health Statistics and Research, Department of Health (Harrisburg, Pennsylvania); and Texas Department of State Health Services. Additional data were acquired from the vital statistics offices of several other states. These state agencies, and other state departments of vital statistics and/or health, disclaim responsibility for any analyses, interpretation and conclusions, which are solely the authors’ own.
References
Footnotes
Contributors KAM and LDD designed the study and data analysis plan. LC and AEG performed statistical analysis of the data. All authors made significant contributions to the interpretation of data and participated in drafting and revising the manuscript. All authors have approved the final version.
Funding The study was sponsored and paid for by the American Chemistry Council. The sponsor had no role in the design, conduct, analysis, reporting of results or preparation of the manuscript. The sponsor was given the opportunity to review a draft manuscript at the time of external peer review. The purpose of such review was to allow input on the clarity of the science presented but not in interpretation of the research findings.
Competing interests All authors are employed by Ramboll Environ US Corporation. Ramboll Environ received financial support from the American Chemistry Council to conduct the study described in the manuscript. Ramboll Environ also has received financial support from, and contracts with, the American Chemistry Council for work on scientific topics unrelated to the submitted manuscript.
Patient consent This study used administrative records only. The outcomes of interest were mortality data. No medical records were reviewed nor obtained.
Ethics approval ENVIRON Institutional Review Board (USDHHS/OHRP/IRB#1265;FWA#00006387).
Provenance and peer review Not commissioned; externally peer reviewed.